Free Access
Fig. 1
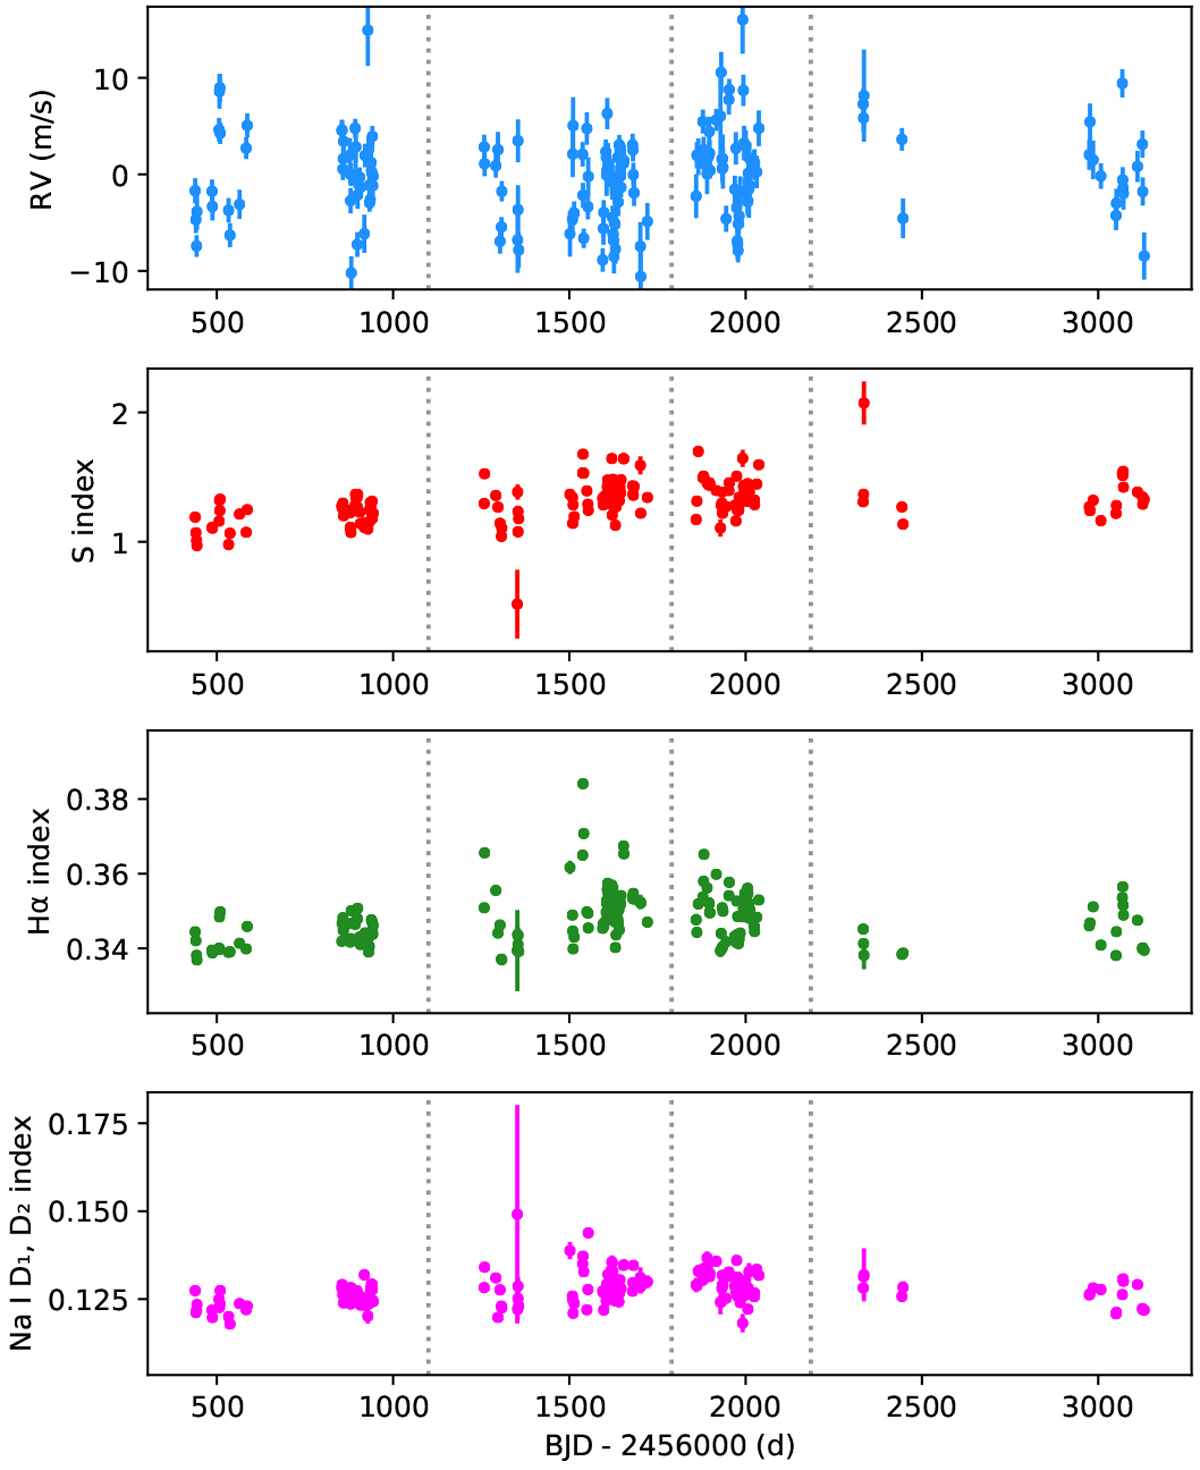
From top to bottom: original RV (derived with the TERRA pipeline), S-index, Hα-index, and Na I D1, D2 -index time series for GJ 9689. Vertical dotted lines indicate the first three observing seasons as used in our study.
Current usage metrics show cumulative count of Article Views (full-text article views including HTML views, PDF and ePub downloads, according to the available data) and Abstracts Views on Vision4Press platform.
Data correspond to usage on the plateform after 2015. The current usage metrics is available 48-96 hours after online publication and is updated daily on week days.
Initial download of the metrics may take a while.