Fig. 6.
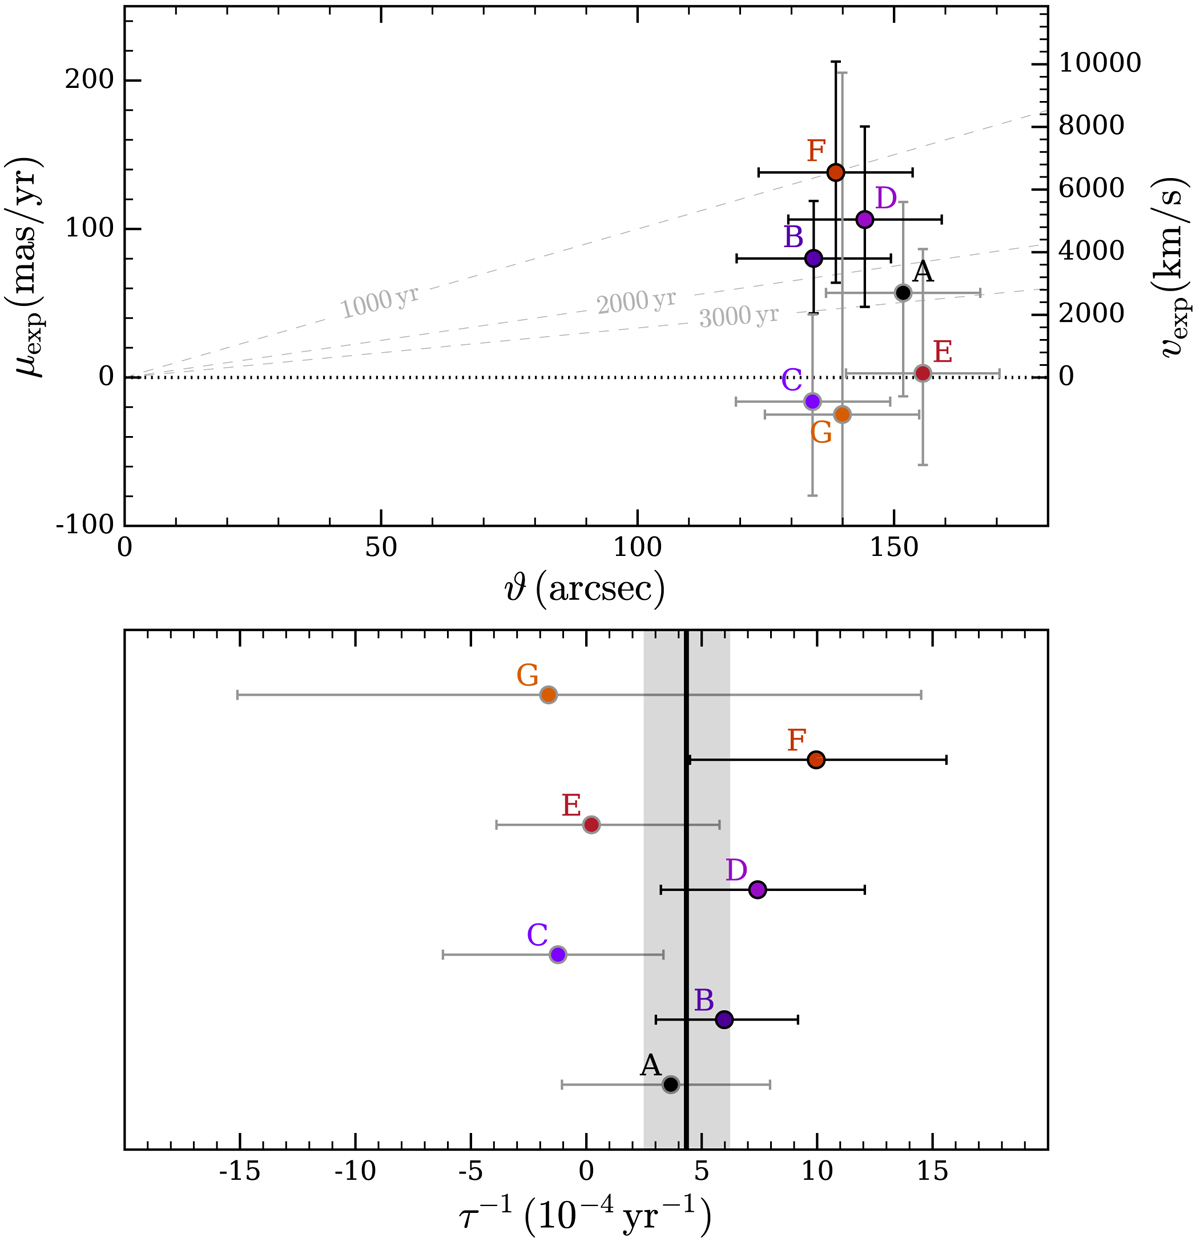
Constraints on the expansion of G15.9+0.2. Top: for each feature (labels as in Fig. 5), we plot the measured angular expansion speed μexp, and the corresponding projected velocity vexp for a distance of 10 kpc, against its angular distance to the SNR center ϑ. To assess their respective significance, we have used black error bars for those measurements that enclose > 95% of the total probability mass on either side of 0, and gray for the others. In addition, we indicate the expected free expansion speed for ages of 1000, 2000, and 3000 years with dashed lines. Bottom: expansion rate τ−1 as measured in each individual region. The thick black line with the gray-shaded area represents the combination of the individual measurements (or weighted average), assuming uniform expansion. All error bars are at 68% confidence. The data underlying this figure are given in Table B.2.
Current usage metrics show cumulative count of Article Views (full-text article views including HTML views, PDF and ePub downloads, according to the available data) and Abstracts Views on Vision4Press platform.
Data correspond to usage on the plateform after 2015. The current usage metrics is available 48-96 hours after online publication and is updated daily on week days.
Initial download of the metrics may take a while.