Fig. 4.
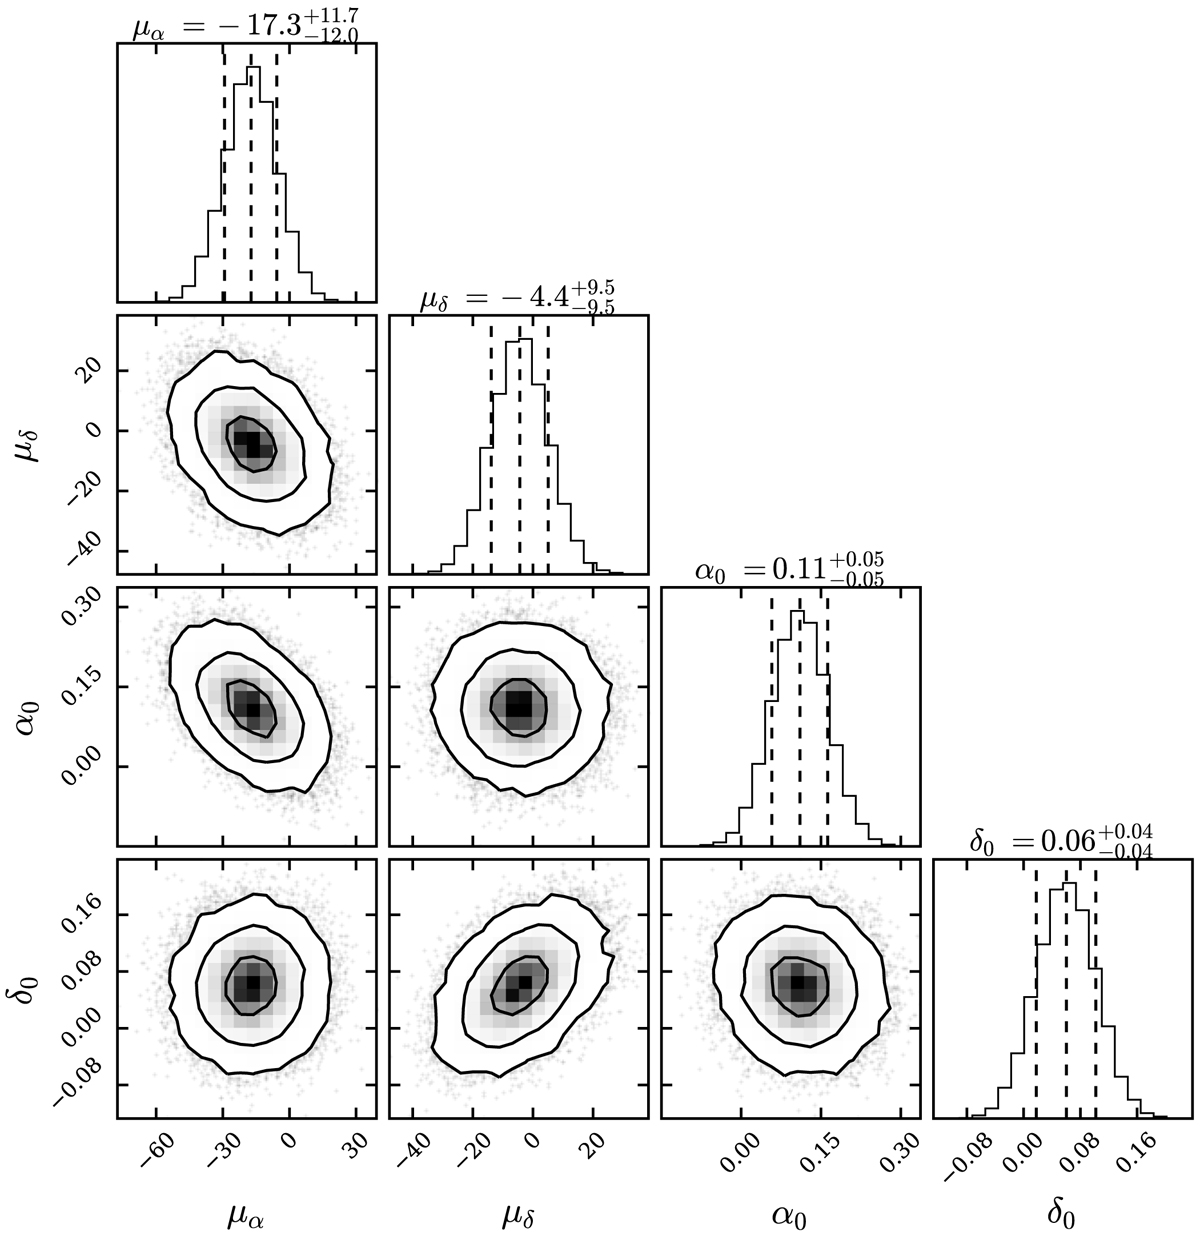
Corner plot displaying the joint and marginal posterior distributions for the parameters of the astrometric solution for the CCO in G15.9+0.2. The astrometric calibration parameters {Δxi, Δyi, ri, θi} have been marginalized over, and are not shown here in order to keep the figure uncluttered (see Table B.1 for constraints on all parameters). In the two-dimensional correlation plots, we indicate the 1σ, 2σ, and 3σ contours, meaning the smallest regions containing 39.3%, 86.5%, and 98.9% of the total probability mass, with solid lines. In the marginalized one-dimensional histograms, we indicate the median and 68% central interval of the posterior probability distribution, with dashed lines. The units of proper motion and the astrometric zero-point are mas yr−1 and arcsec, respectively. This plot and analogous figures have been created using the corner.py package (Foreman-Mackey 2016).
Current usage metrics show cumulative count of Article Views (full-text article views including HTML views, PDF and ePub downloads, according to the available data) and Abstracts Views on Vision4Press platform.
Data correspond to usage on the plateform after 2015. The current usage metrics is available 48-96 hours after online publication and is updated daily on week days.
Initial download of the metrics may take a while.