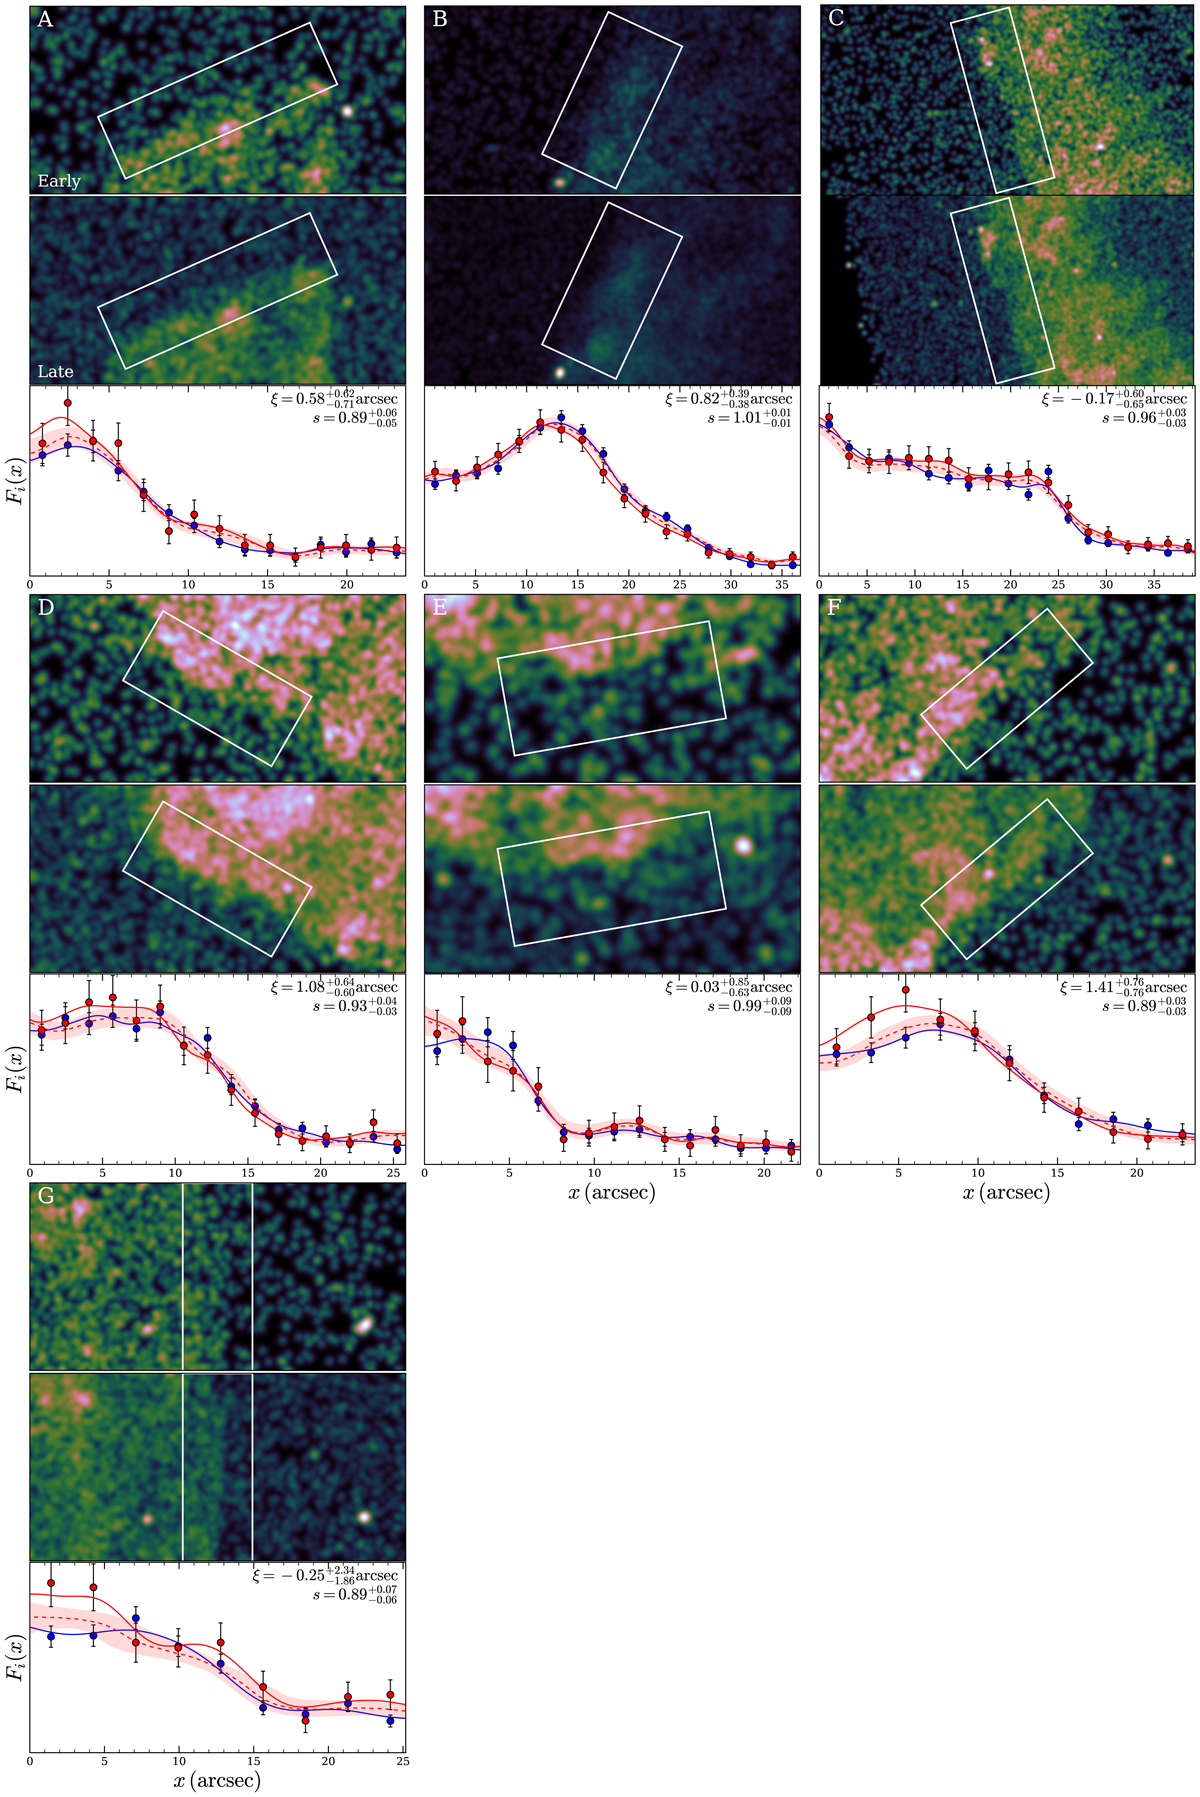
Fig. C.1.

Direct comparison of flux profiles in different regions of G15.9+0.2. Each panel is labeled with the letter corresponding to the respective region. Top and middle sub-panels: exposure corrected images at the early and late epoch, and the white rectangle outlines the measurement region. Bottom sub-panel: one-dimensional flux profiles Fi(x) at the early (red) and late (blue) epoch. The x coordinate increases outward along the radial direction of the SNR. The markers display the binned distribution, and the solid line reflects the flux profile smoothed with a Gaussian kernel. The dashed red line corresponds to the profile of the early epoch, shifted and rescaled by the parameters indicated in the upper right corner, with the shaded area displaying the associated uncertainty.
Current usage metrics show cumulative count of Article Views (full-text article views including HTML views, PDF and ePub downloads, according to the available data) and Abstracts Views on Vision4Press platform.
Data correspond to usage on the plateform after 2015. The current usage metrics is available 48-96 hours after online publication and is updated daily on week days.
Initial download of the metrics may take a while.


