Fig. 14.
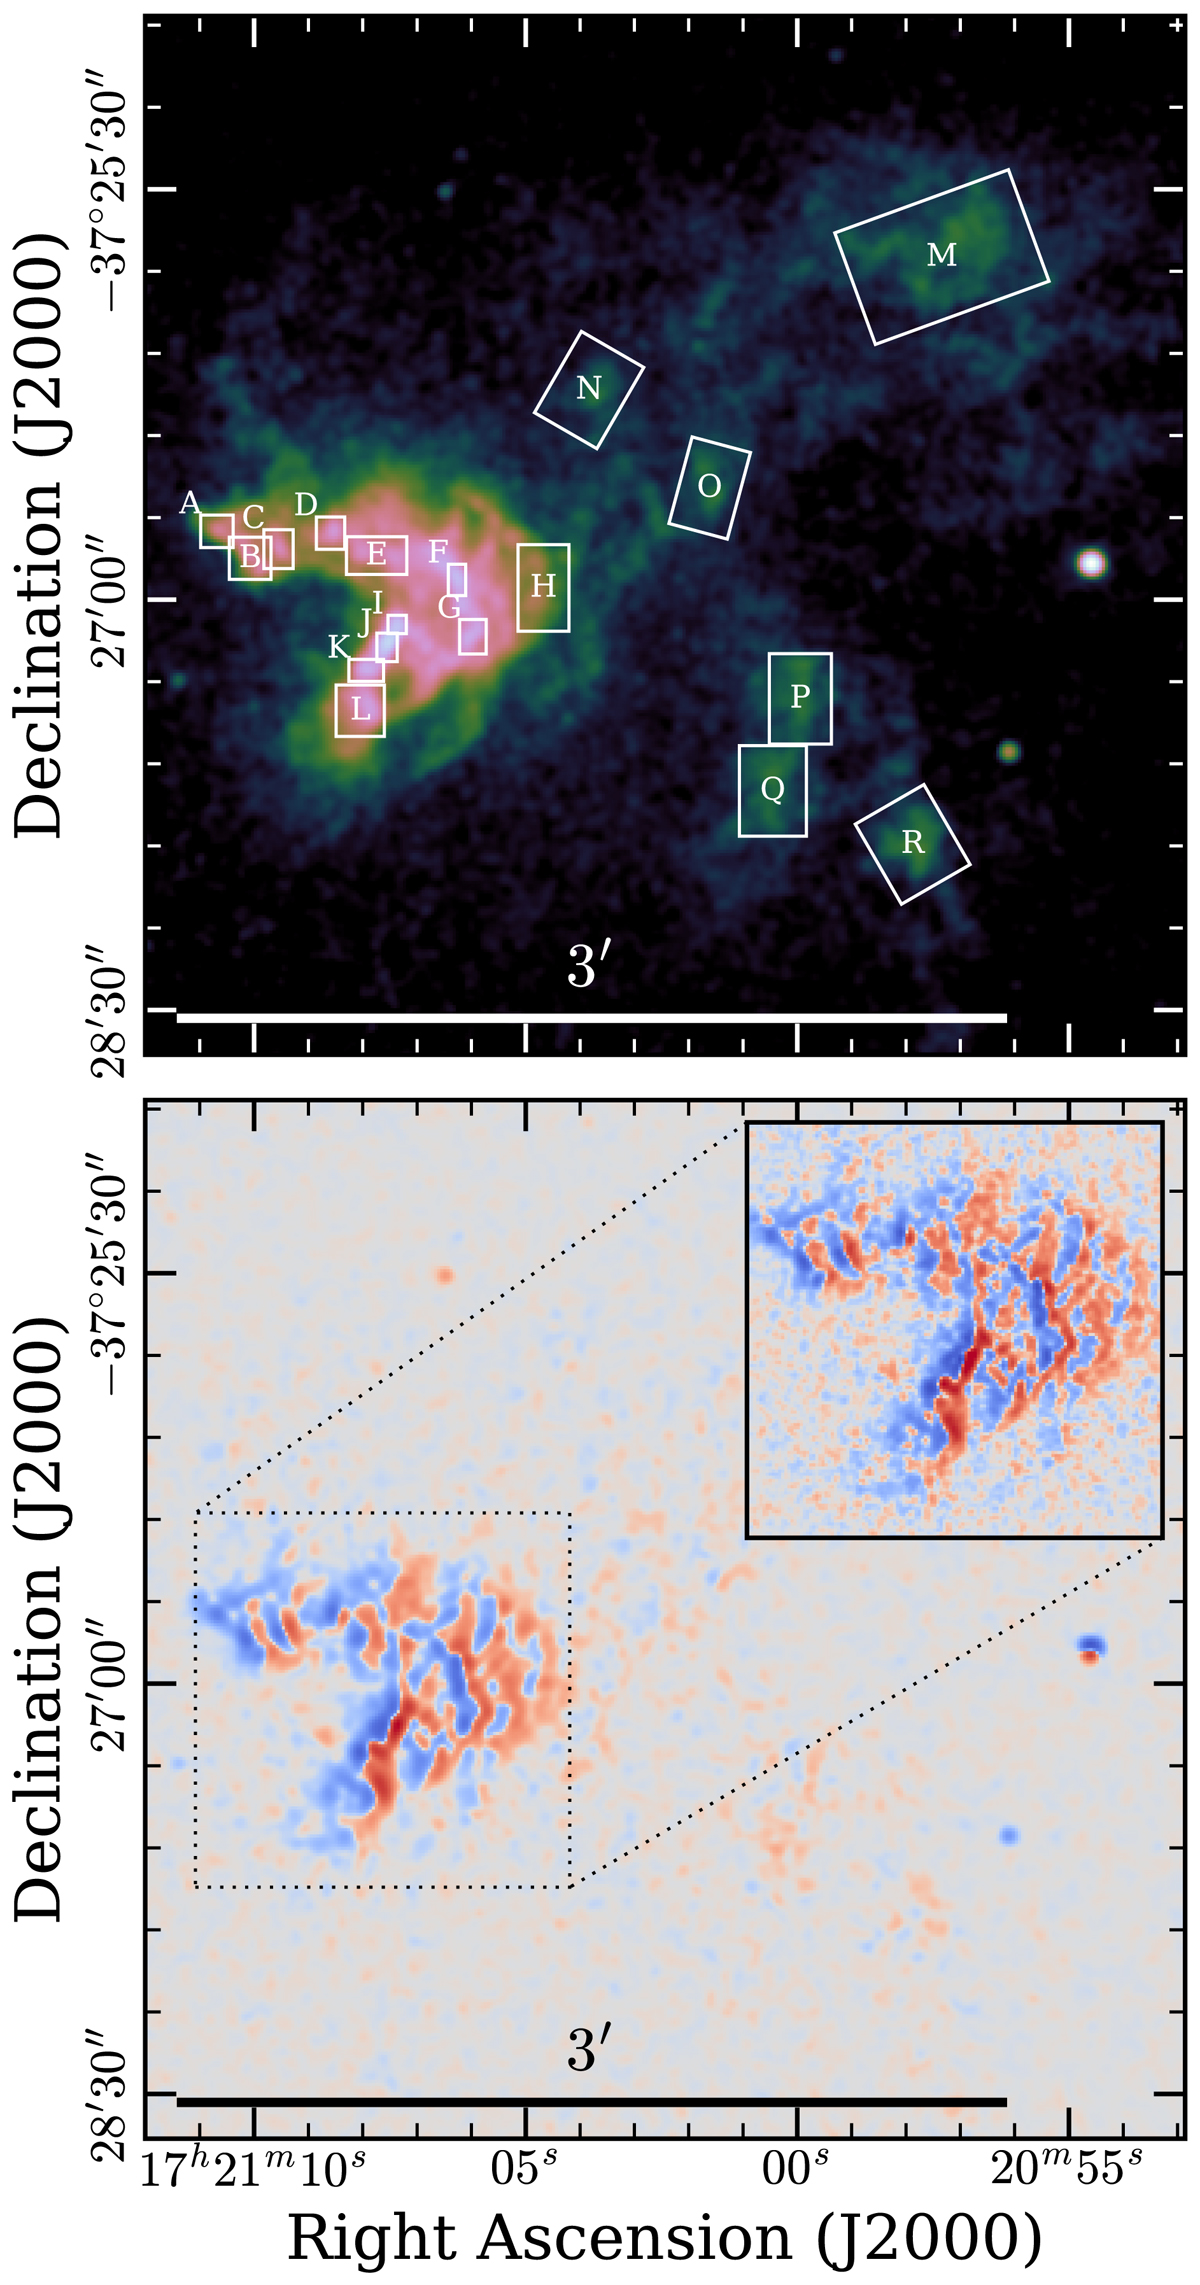
SNR G350.1−0.3 with regions used for the expansion measurement indicated. Top panel: as in Fig. 5. Bottom panel: difference image between the early and late epochs. We use a symmetric logarithmic color scale to highlight features on small scales, with blue corresponding to the late-epoch emission being brighter, and red being the opposite. For the main image, we smoothed the data with a Gaussian kernel of 1″, while in the inset we show the region of the bright clump smoothed with only 0.5″.
Current usage metrics show cumulative count of Article Views (full-text article views including HTML views, PDF and ePub downloads, according to the available data) and Abstracts Views on Vision4Press platform.
Data correspond to usage on the plateform after 2015. The current usage metrics is available 48-96 hours after online publication and is updated daily on week days.
Initial download of the metrics may take a while.