Fig. 2.
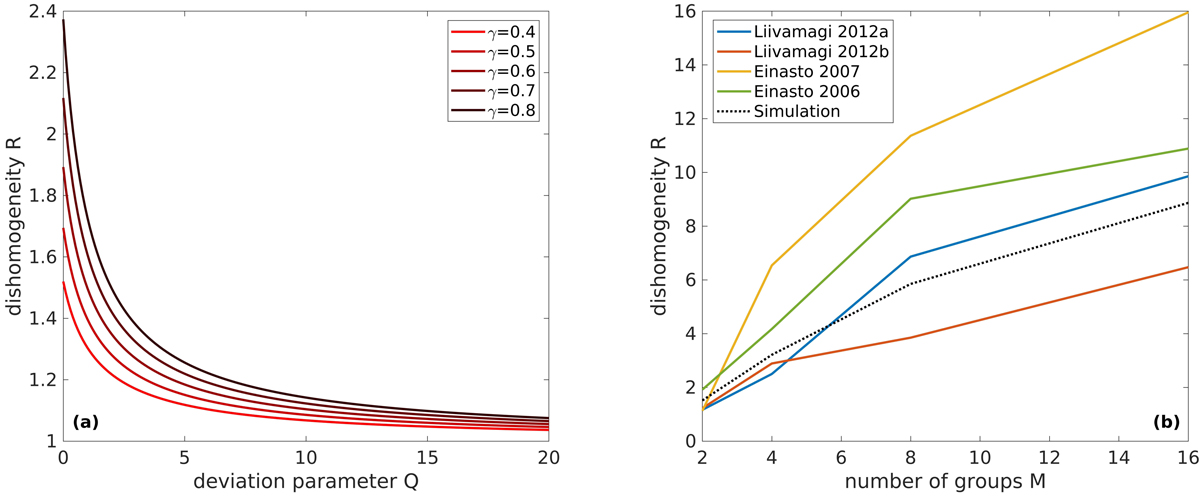
Inhomogeneity. Panel a: average large-scale fluctuations of two subsamples as a function of the deviation parameter Q and for various values of Zipf’s exponent γ. The index R is defined as the ratio between the size of the largest structure in the first subsample and that of the largest structures in the second subsample. In this way, R = 1 corresponds to the absence of large-scale fluctuations. Panel b: fluctuations of the four catalogs we analyzed in Fig. 1a when they are divided in M subgroups. In this case, the ratio was computed between the size of the largest structure and the size of the largest structure of subsample m, where m is the subsample with the smallest largest structure, compared to the other subsamples. The dotted line is the fluctuation parameter of a synthetic sample of 100 sizes, which perfectly adhere to Zipf’s law with exponent γ = 0.6.
Current usage metrics show cumulative count of Article Views (full-text article views including HTML views, PDF and ePub downloads, according to the available data) and Abstracts Views on Vision4Press platform.
Data correspond to usage on the plateform after 2015. The current usage metrics is available 48-96 hours after online publication and is updated daily on week days.
Initial download of the metrics may take a while.