Fig. 1.
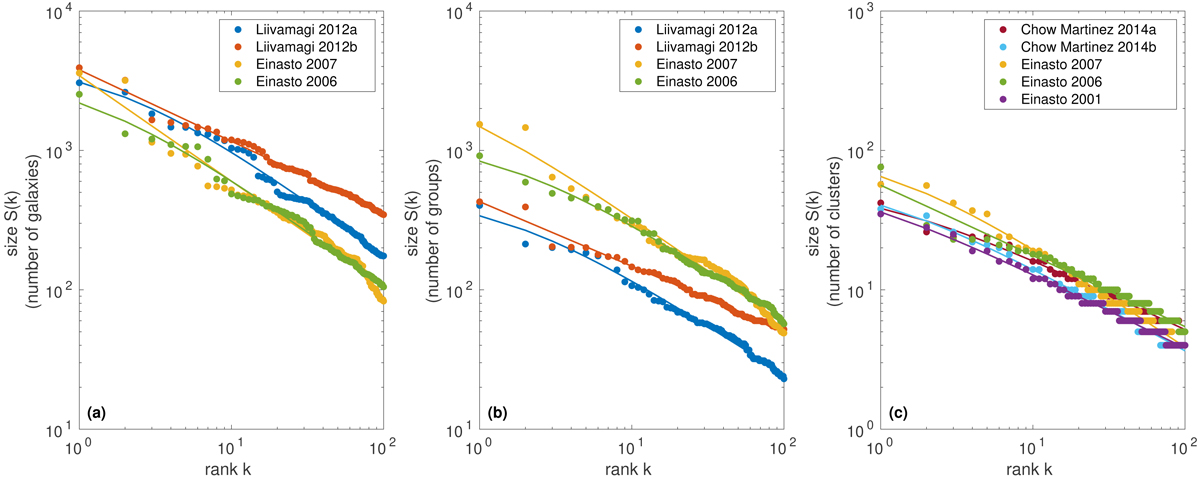
Rank-size plots of superclusters. Panel a: rank-size plots of superclusters ordered by the number of galaxies they contain. Panel b: rank-size plots of superclusters ordered by the number of groups they contain. Panel c: rank-size plots of superclusters ordered by the number of clusters they contain. Solid lines are fits to Zipf–Mandelbrot law, see the Appendix A for details. In all three cases, we observe a pure Zipf’s law with only minor deviations, as is also discussed in the text.
Current usage metrics show cumulative count of Article Views (full-text article views including HTML views, PDF and ePub downloads, according to the available data) and Abstracts Views on Vision4Press platform.
Data correspond to usage on the plateform after 2015. The current usage metrics is available 48-96 hours after online publication and is updated daily on week days.
Initial download of the metrics may take a while.