Fig. 8
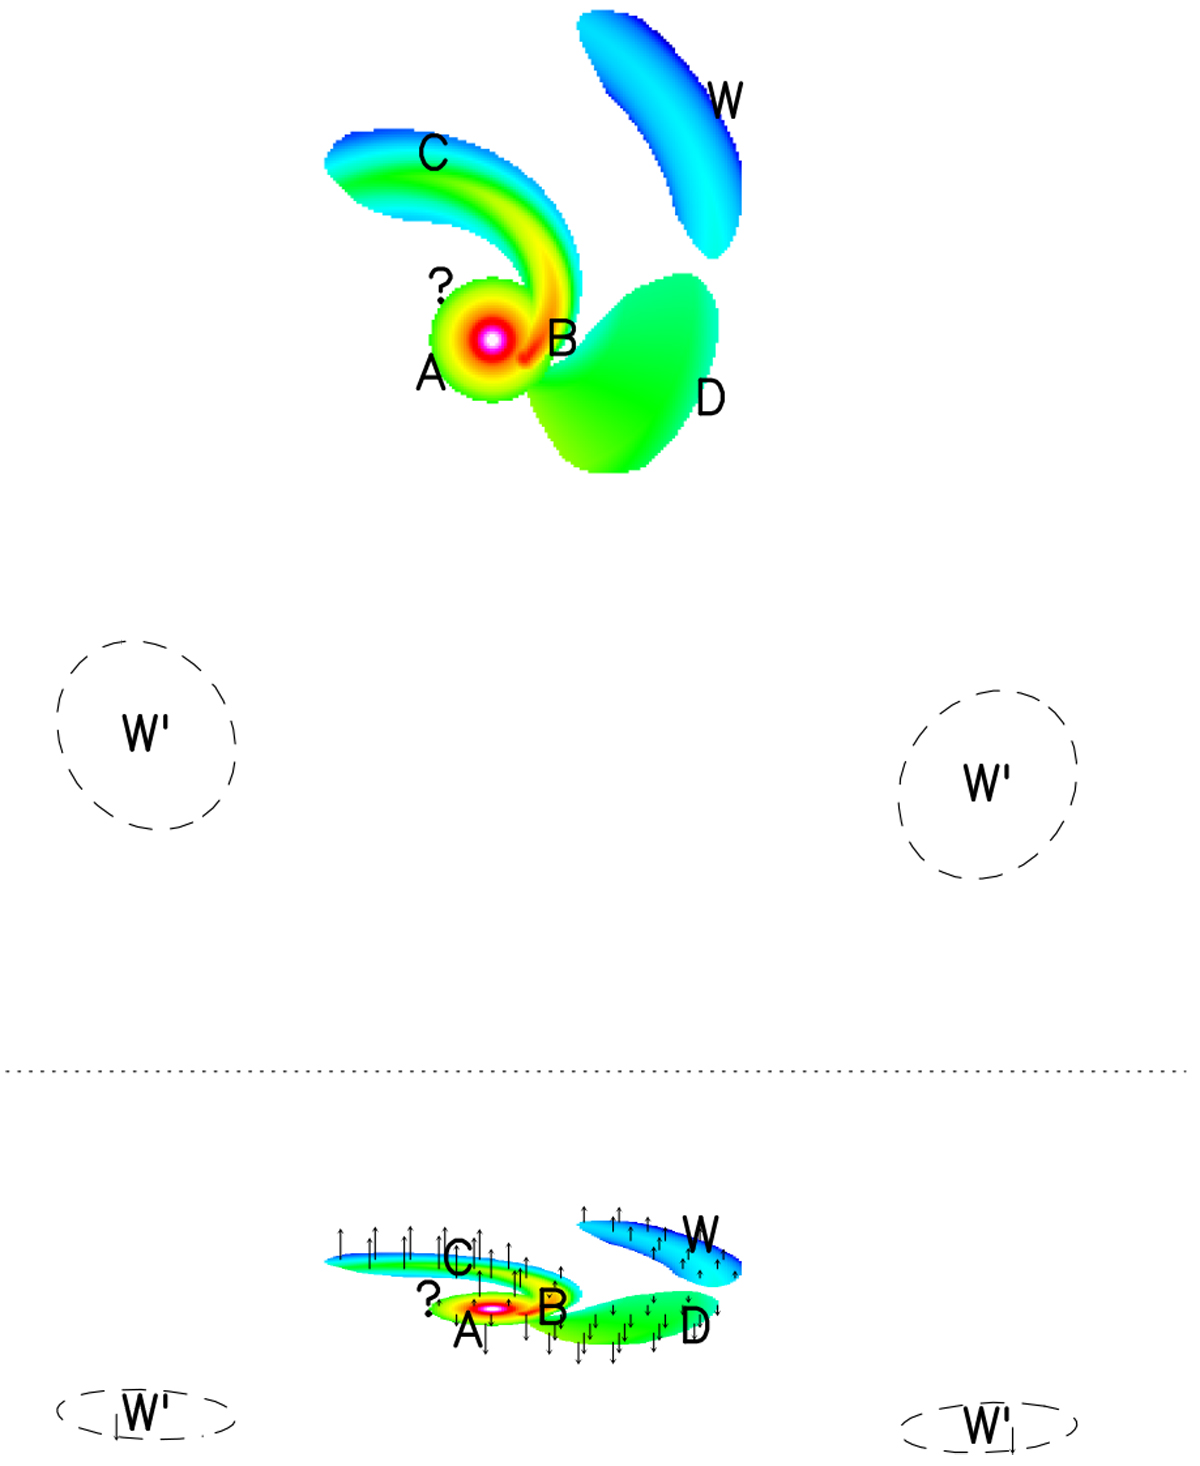
Top: main components identified in our simple model (see Sect. 4.1). Bottom (below the dotted line): Representative image of the equatorial density distribution as seen with the actual inclination of the equator. This image is a very simplified representation to facilitate interpretation, in which the latitude density distribution is not accounted for. The projection of the equatorial velocity in the direction to the observer is also represented (directly taken from the velocity vectors in Fig. 6, top). Again this is only illustrative because the off-equator movements are not considered. Downward arrows represent gas approaching the observer (relatively negative LSR velocities), while arrows pointing upward mean that the gas recedes from us (relatively positive LSR velocities).
Current usage metrics show cumulative count of Article Views (full-text article views including HTML views, PDF and ePub downloads, according to the available data) and Abstracts Views on Vision4Press platform.
Data correspond to usage on the plateform after 2015. The current usage metrics is available 48-96 hours after online publication and is updated daily on week days.
Initial download of the metrics may take a while.