Fig. 6
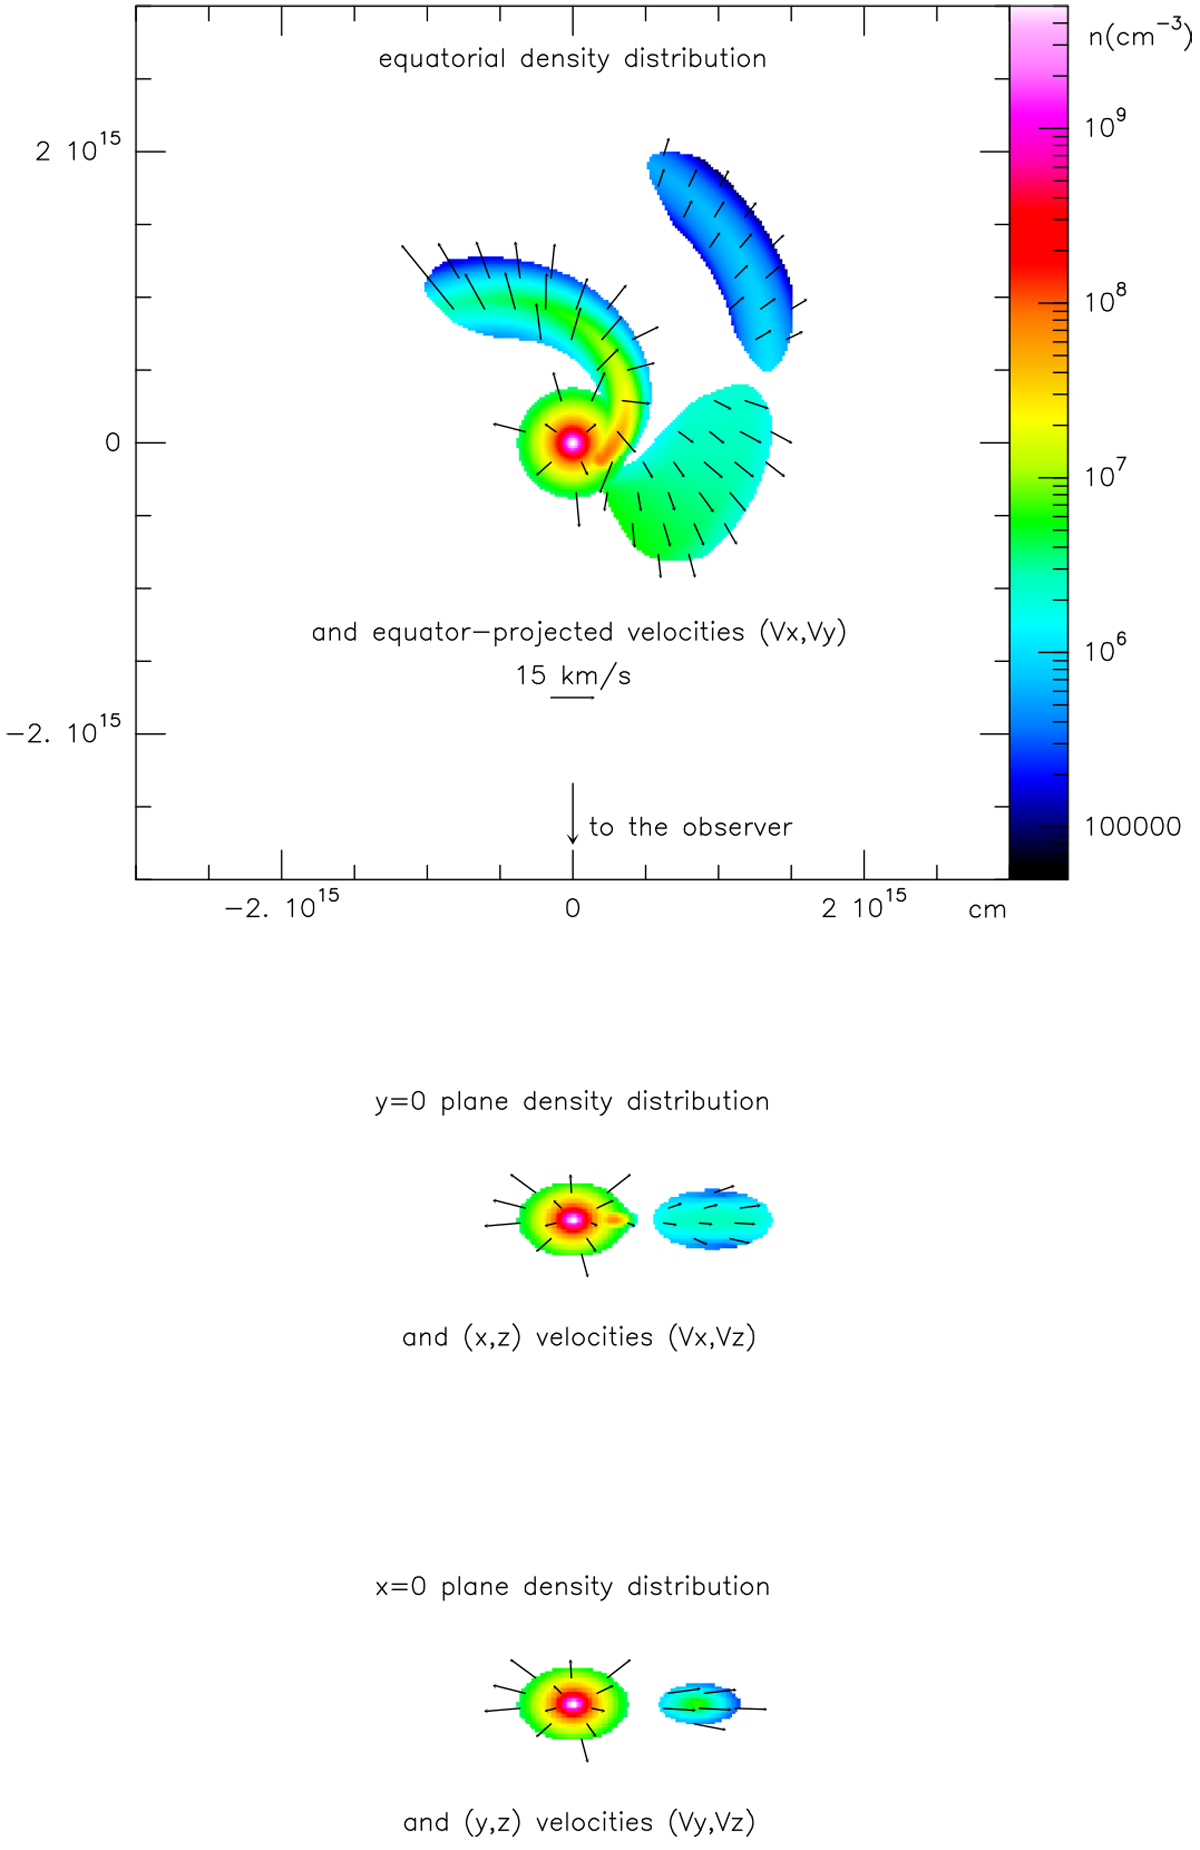
Top: density distribution of the CO-rich gas in the plane of the equator (z = 0 plane in our coordinates) from our best-fit model. Equatorial velocities are also represented. Middle: density distribution in the y = 0 plane and velocities projected in that plane. Bottom: same, but for the x = 0 plane. All representations share the same units and scales.
Current usage metrics show cumulative count of Article Views (full-text article views including HTML views, PDF and ePub downloads, according to the available data) and Abstracts Views on Vision4Press platform.
Data correspond to usage on the plateform after 2015. The current usage metrics is available 48-96 hours after online publication and is updated daily on week days.
Initial download of the metrics may take a while.