Fig. 4
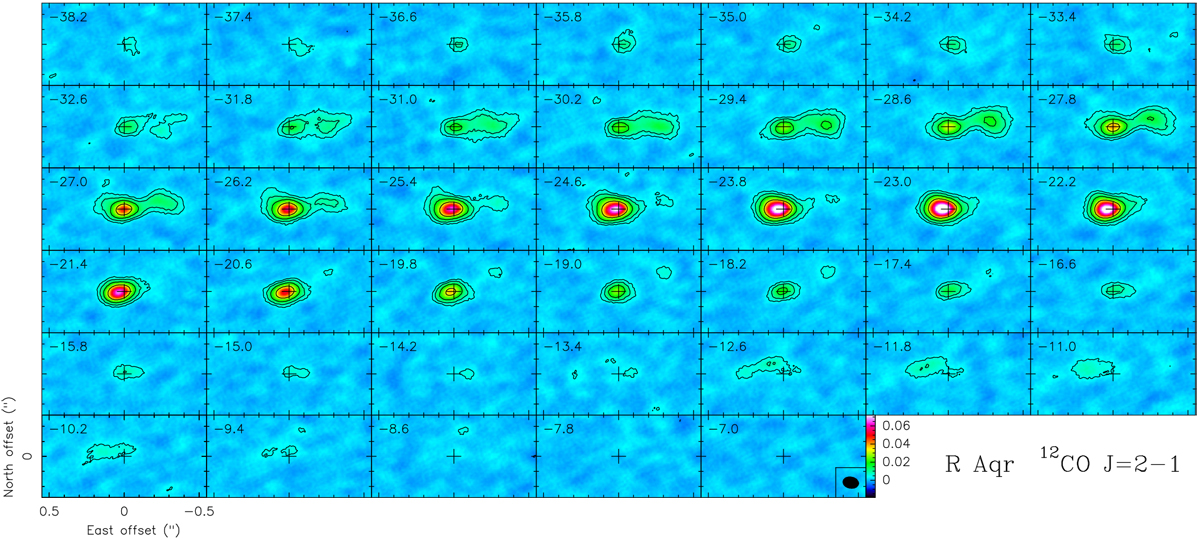
ALMA maps per velocity channel of 12CO J = 2−1 emission in R Aqr; see the LSR velocities in the upper left corners, similar to Fig. 1. The contours are logarithmic, with a jump of a factor 2 and a first level of 4 mJy beam−1, equivalent to 4.9 rms and 11.33 K. The dashed contours represent negative values. The HPBW is shown in the inset in the last panel.
Current usage metrics show cumulative count of Article Views (full-text article views including HTML views, PDF and ePub downloads, according to the available data) and Abstracts Views on Vision4Press platform.
Data correspond to usage on the plateform after 2015. The current usage metrics is available 48-96 hours after online publication and is updated daily on week days.
Initial download of the metrics may take a while.