Fig. 3
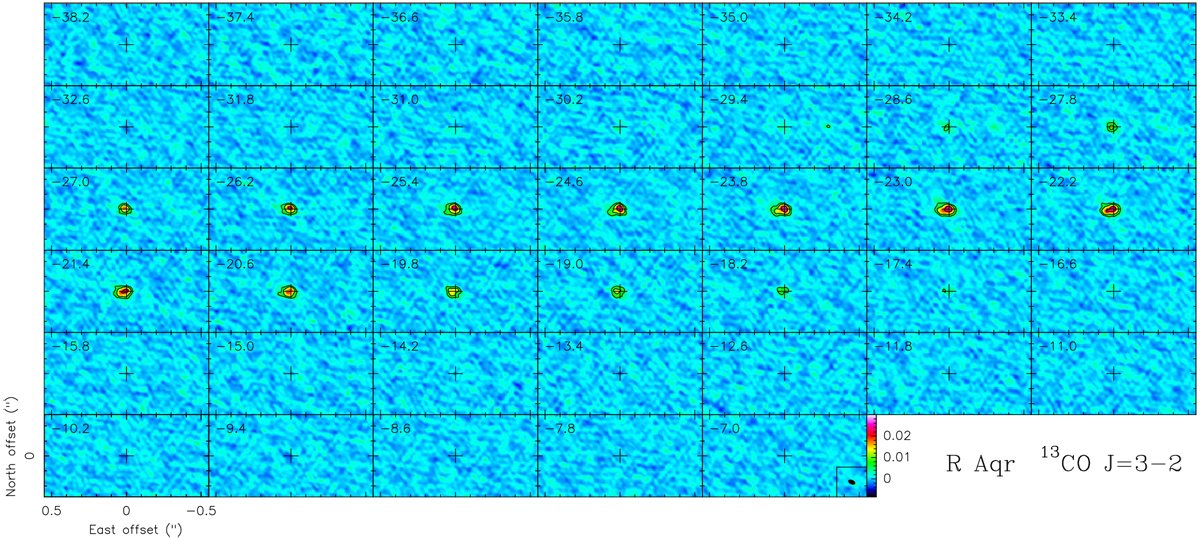
ALMA maps per velocity channel of 13CO J = 3−2 emission in R Aqr (only the more extended array configuration); see the LSR velocities in the upper left corners. The center is the centroid of the continuum, whose image has been subtracted. The logarithmic contours and scales are the same as in Fig. 1 (in this case, the first contour, 5 mJy beam−1, is equivalentto 5.6 times the rms and 35.2 K). The HPBW is shown in the inset in the last panel.
Current usage metrics show cumulative count of Article Views (full-text article views including HTML views, PDF and ePub downloads, according to the available data) and Abstracts Views on Vision4Press platform.
Data correspond to usage on the plateform after 2015. The current usage metrics is available 48-96 hours after online publication and is updated daily on week days.
Initial download of the metrics may take a while.