Fig. 15.
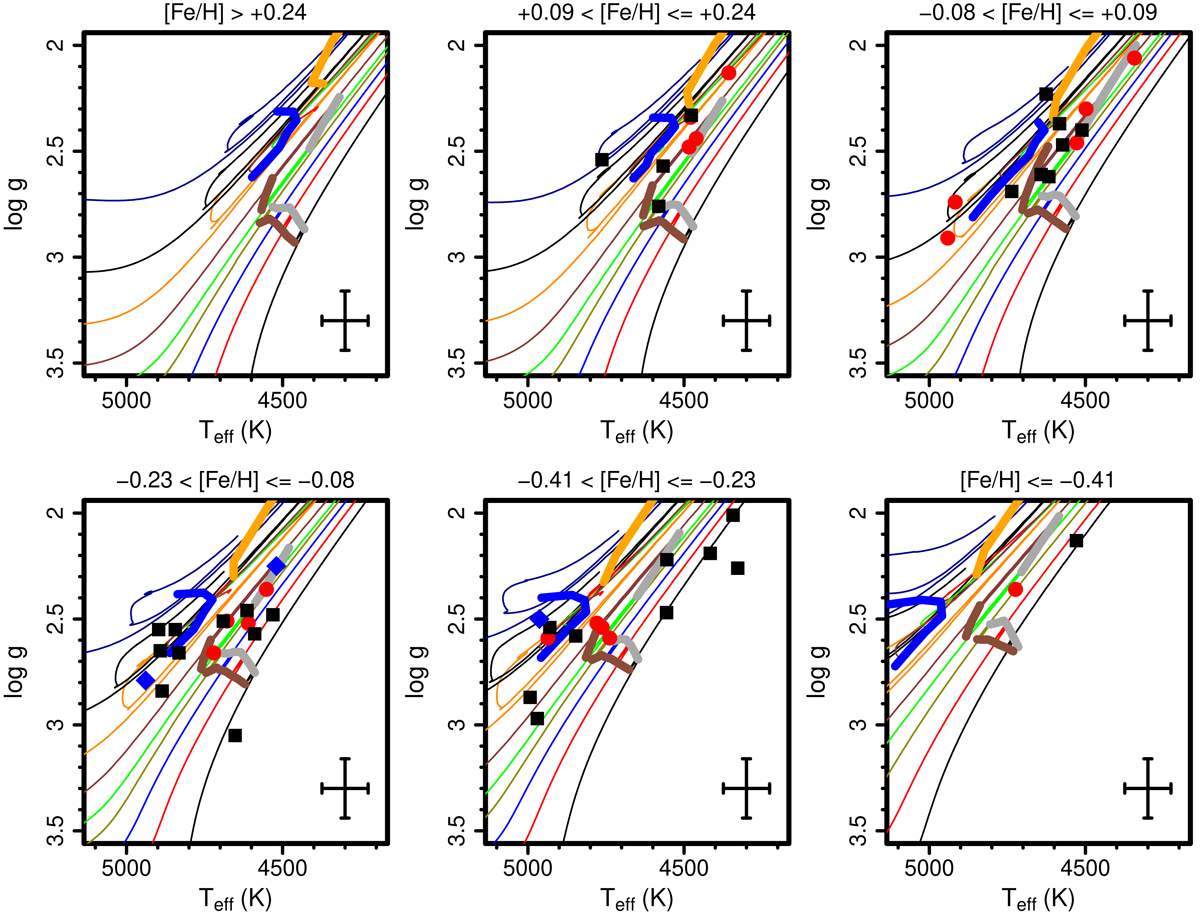
Kiel diagram of the Li-rich *A(Li) ≥ 2.0 dex) giant stars compared with PARSEC evolutionary tracks (Bressan et al. 2012; Fu et al. 2018) of masses 0.8, 1.0, 1.2, 1.4, 1.5, 1.7, 2.0, 2.4, and 3.0 M⊙. From the top left to the bottom right panels: the models have [Fe/H] = +0.30, +0.18, 0.00, −0.15, −0.30, and −0.52 dex. The range of [Fe/H] of the stars is given at the top of each panel. Field stars with A(Li) ≥ 3.3 dex are shown as red circles, while stars with 2.0 dex ≤ A(Li) < 3.3 dex are marked with black squares. The three Li-rich stars in open clusters are shown as blue diamonds. The beginning and end of the RGB luminosity bump are marked as thick grey and brown lines, respectively. The position of the clump of low-mass giants is shown as a thick blue line (from 0.8 to 1.9 M⊙). The beginning of the early-AGB of intermediate-mass stars (≥ 2.0 M⊙) is highlighted as the thick orange line. Typical error bars are shown in the bottom right corner of the panels.
Current usage metrics show cumulative count of Article Views (full-text article views including HTML views, PDF and ePub downloads, according to the available data) and Abstracts Views on Vision4Press platform.
Data correspond to usage on the plateform after 2015. The current usage metrics is available 48-96 hours after online publication and is updated daily on week days.
Initial download of the metrics may take a while.