Fig. 12.
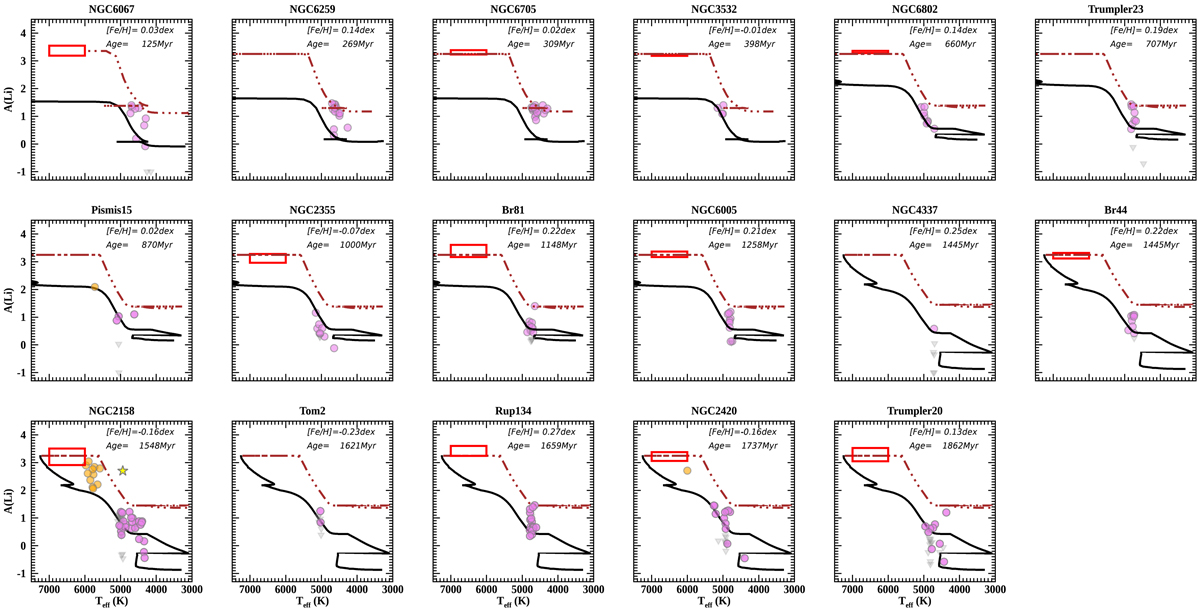
A(Li) vs. Teff for 17 Gaia-ESO clusters with ages ≤ 1.8 Gyr. Giant stars are indicated with pink circles, stars with upper limits of A(Li) are shown with grey triangles, sub-giants are indicated with orange circles, and Li-rich giants are marked with yellow stars. The red rectangles show the location of the initial A(Li), derived as in Randich et al. (2020). The theoretical tracks of Lagarde et al. (2012) are selected on the basis of the age and metallicity of each cluster (classical models are shown with dot-dashed brown curves, and rotation-induced mixing models with continuous black curves). Cluster metallicity and age are reported in each panel.
Current usage metrics show cumulative count of Article Views (full-text article views including HTML views, PDF and ePub downloads, according to the available data) and Abstracts Views on Vision4Press platform.
Data correspond to usage on the plateform after 2015. The current usage metrics is available 48-96 hours after online publication and is updated daily on week days.
Initial download of the metrics may take a while.