Fig. 11.
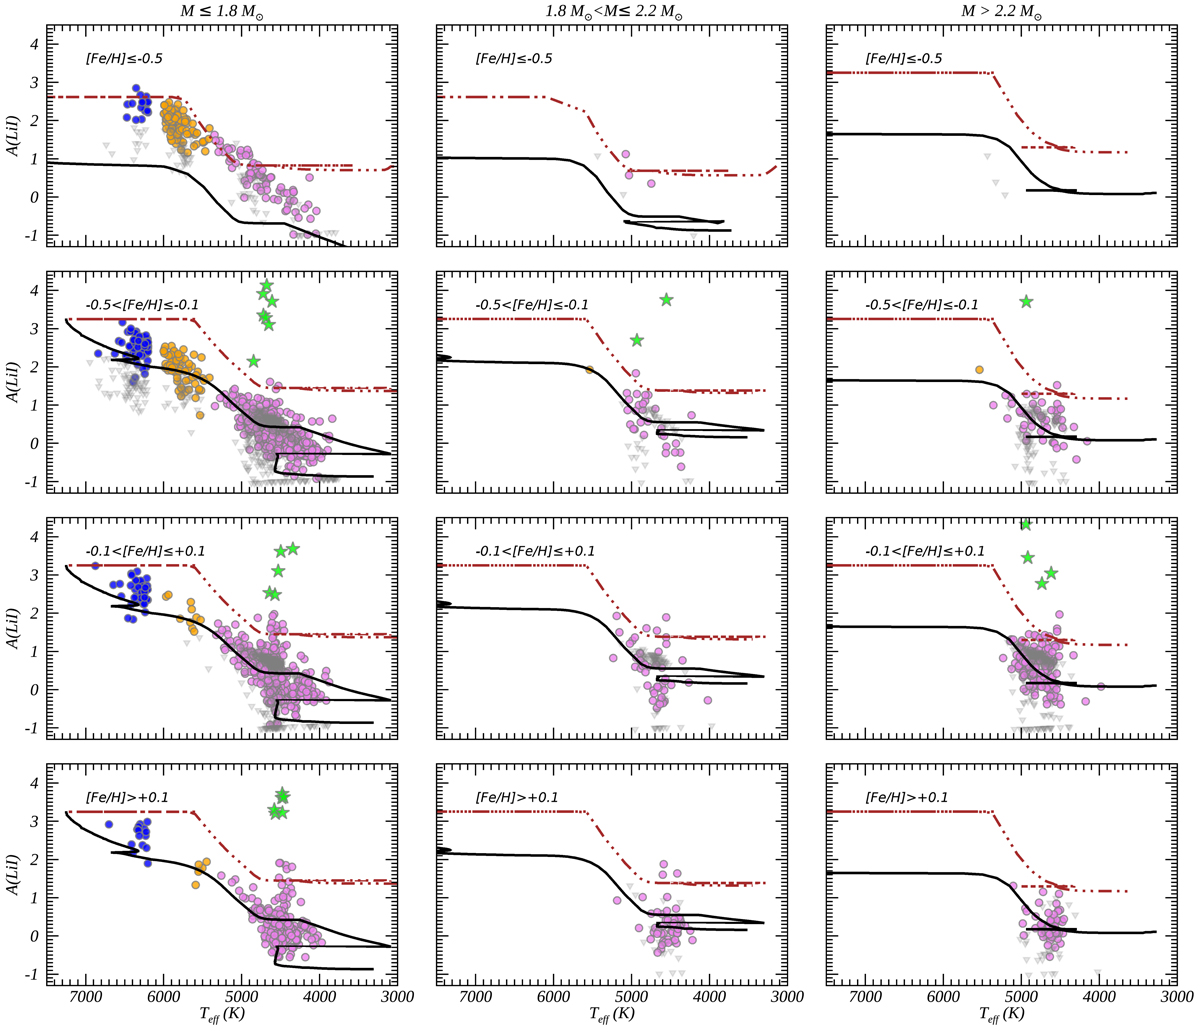
A(Li) vs. Teff in the field stars sample for which the mass was estimated. We plot in blue the MSTO stars (with Teff > 6200 K), in orange the sub-giant stars, and in pink the giant stars. Li upper limits are shown with grey triangles. The curves are the predictions of the models of Lagarde et al. (2012) for 1.5 M⊙, 2.0 M⊙, and 3.0 M⊙ with standard mixing (dashed lines) and with rotation-induced mixing and thermohaline instability (continuous lines). In the panels for [Fe/H] < −0.5 dex and M≤2.2 M⊙, we adopt the models at [Fe/H] = −0.56, and in the other panels the models at [Fe/H] = 0. The Li-rich stars with a mass determination are indicated with green stars.
Current usage metrics show cumulative count of Article Views (full-text article views including HTML views, PDF and ePub downloads, according to the available data) and Abstracts Views on Vision4Press platform.
Data correspond to usage on the plateform after 2015. The current usage metrics is available 48-96 hours after online publication and is updated daily on week days.
Initial download of the metrics may take a while.