Fig. 10.
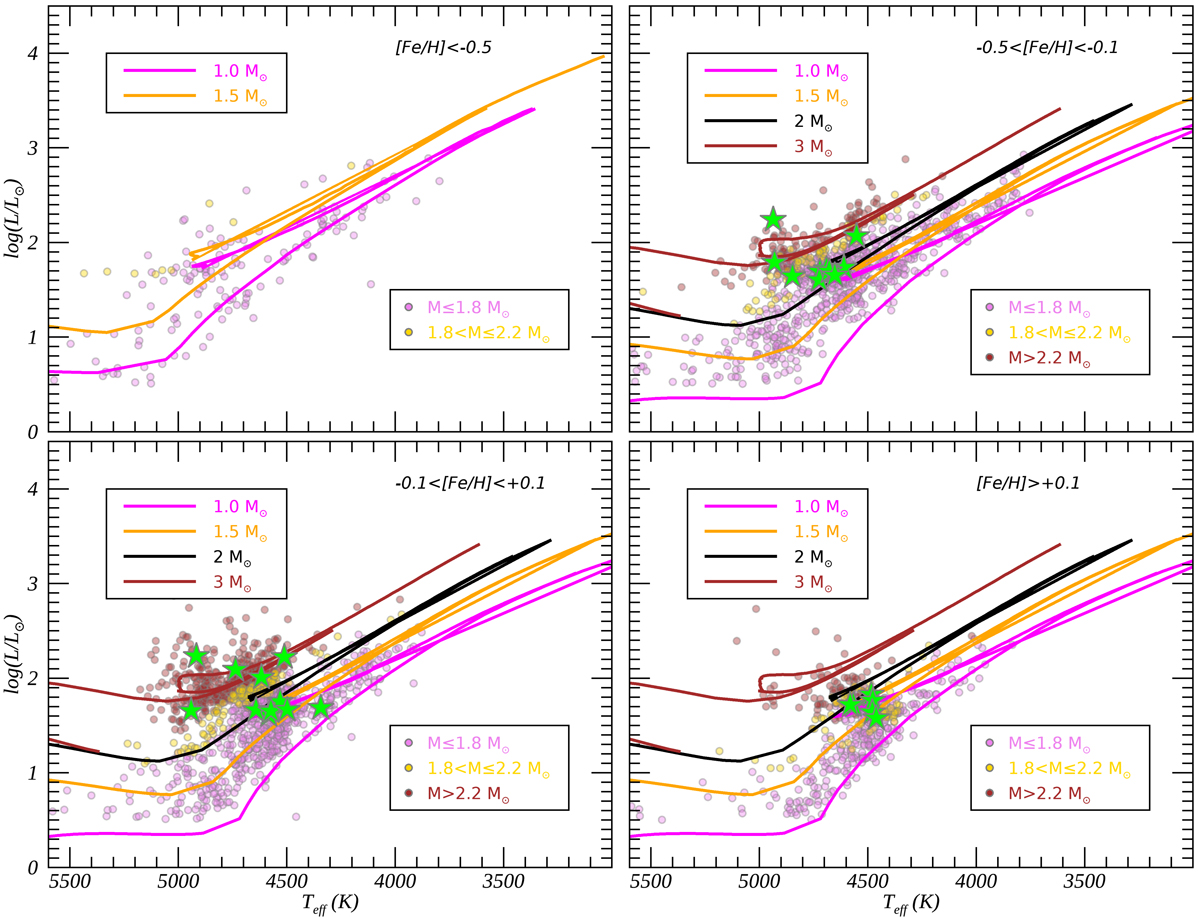
Location of our sample of sub-giant and giant field stars in the HR diagram in the four metallicity bins. The stars (filled circles) are colour-coded by their masses: in pink we show stars with M ≤ 1.2 M⊙, in yellow we plot stars with 1.2 M⊙ < M ≤ 2.2 M⊙, and in red we show stars with M > 2.2 M⊙. The Li-rich giant stars with a mass determination are marked with green stars. The theoretical evolutionary tracks are plotted for masses between 1 and 3 M⊙. In the top left panel, corresponding to the metallicity bin with [Fe/H] ≤ −0.5, we adopt the tracks computed for [Fe/H] = −0.56, while in the other bins we plot the tracks at the solar metallicity.
Current usage metrics show cumulative count of Article Views (full-text article views including HTML views, PDF and ePub downloads, according to the available data) and Abstracts Views on Vision4Press platform.
Data correspond to usage on the plateform after 2015. The current usage metrics is available 48-96 hours after online publication and is updated daily on week days.
Initial download of the metrics may take a while.