Fig. 1.
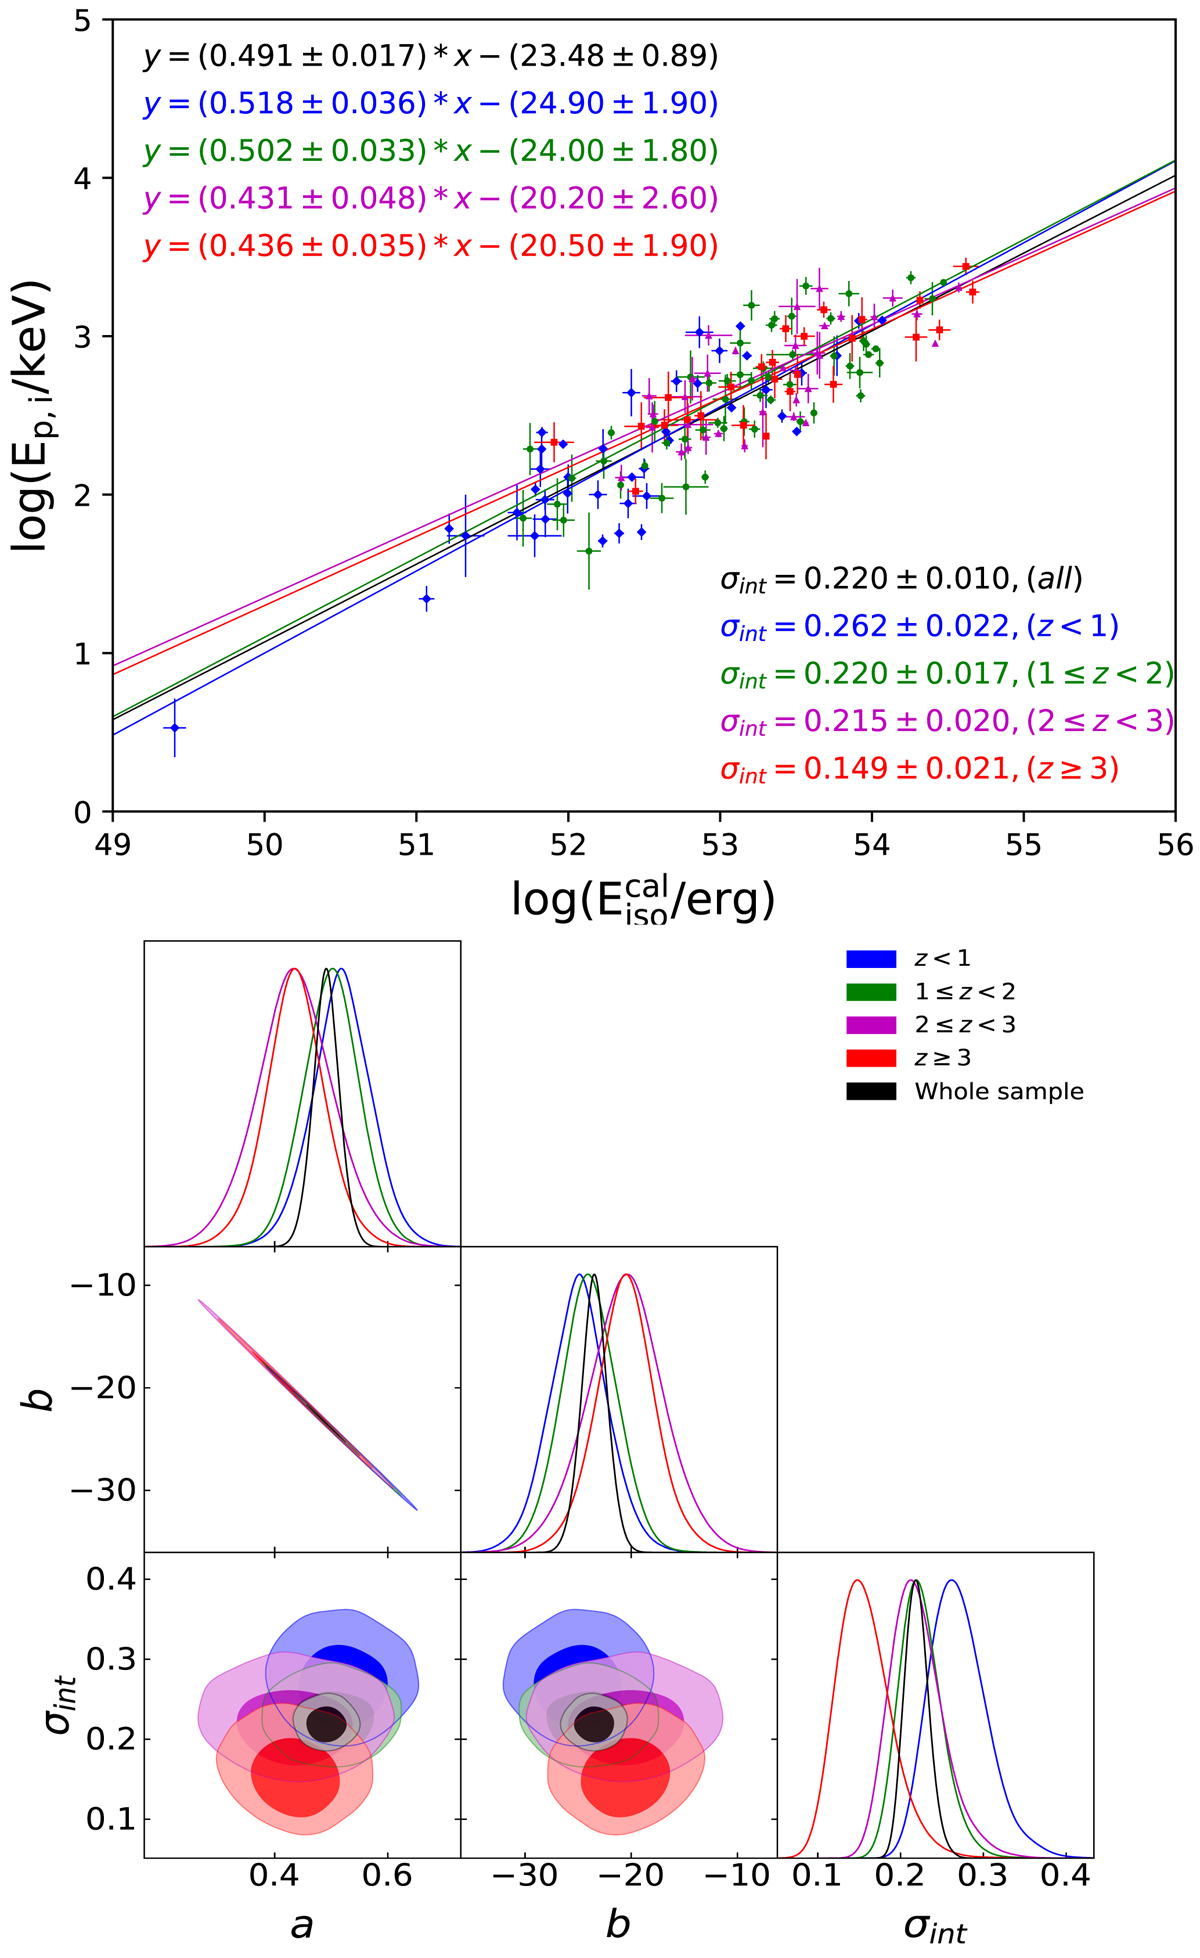
Upper panel: fitting results for Amati relation with GRB samples in different redshift range (the black line is for the whole sample, the blue line is for 0.125 < z ≤ 1, the green line is for 1 < z ≤ 2, the purple line is for 2 < z ≤ 3, and the red line is for z ≥ 3), where the GRB distance moduli were calibrated by the quasar data. Lower panel: 1D marginalized distributions and 2D plots with 1σ and 2σ contours for luminosity correlation parameters.
Current usage metrics show cumulative count of Article Views (full-text article views including HTML views, PDF and ePub downloads, according to the available data) and Abstracts Views on Vision4Press platform.
Data correspond to usage on the plateform after 2015. The current usage metrics is available 48-96 hours after online publication and is updated daily on week days.
Initial download of the metrics may take a while.