Fig. 5.
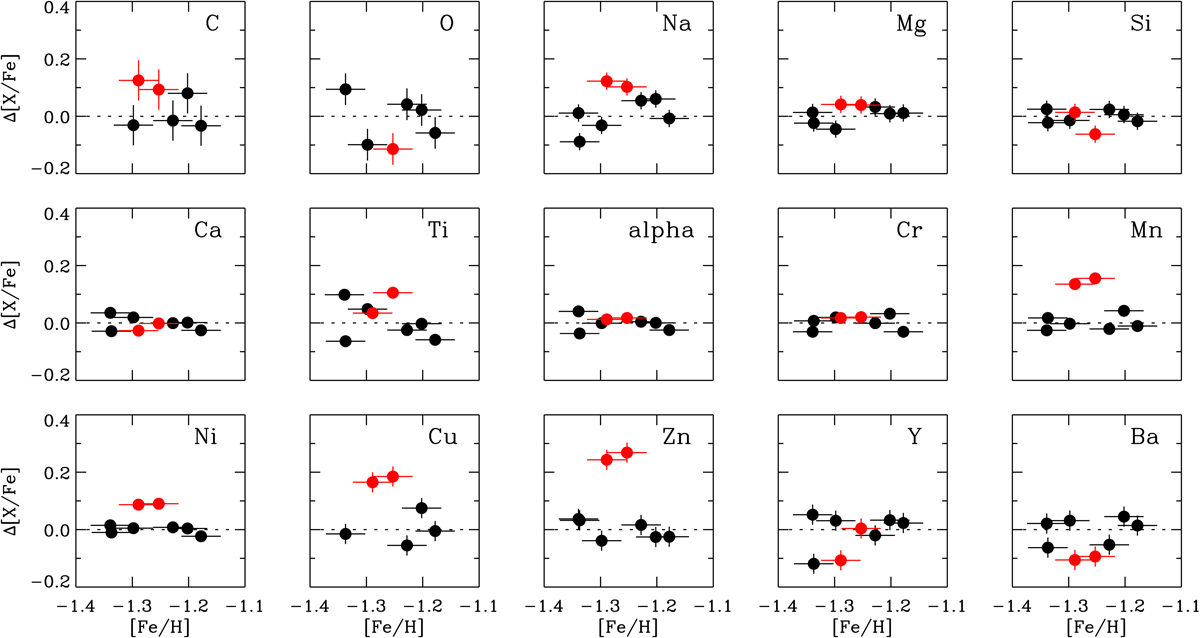
Difference in [X/Fe] for stars in Table 2 relative to the mean of [X/Fe] for the six comparison stars as a function of [Fe/H]. G 112-43 and G 112-44 are shown with red filled circles and the comparison stars with black filled circles. The error bars refer to the 1σ uncertainties of the abundance ratios. Non-LTE corrections of [X/Fe] are included when available.
Current usage metrics show cumulative count of Article Views (full-text article views including HTML views, PDF and ePub downloads, according to the available data) and Abstracts Views on Vision4Press platform.
Data correspond to usage on the plateform after 2015. The current usage metrics is available 48-96 hours after online publication and is updated daily on week days.
Initial download of the metrics may take a while.