Free Access
Fig. 4.
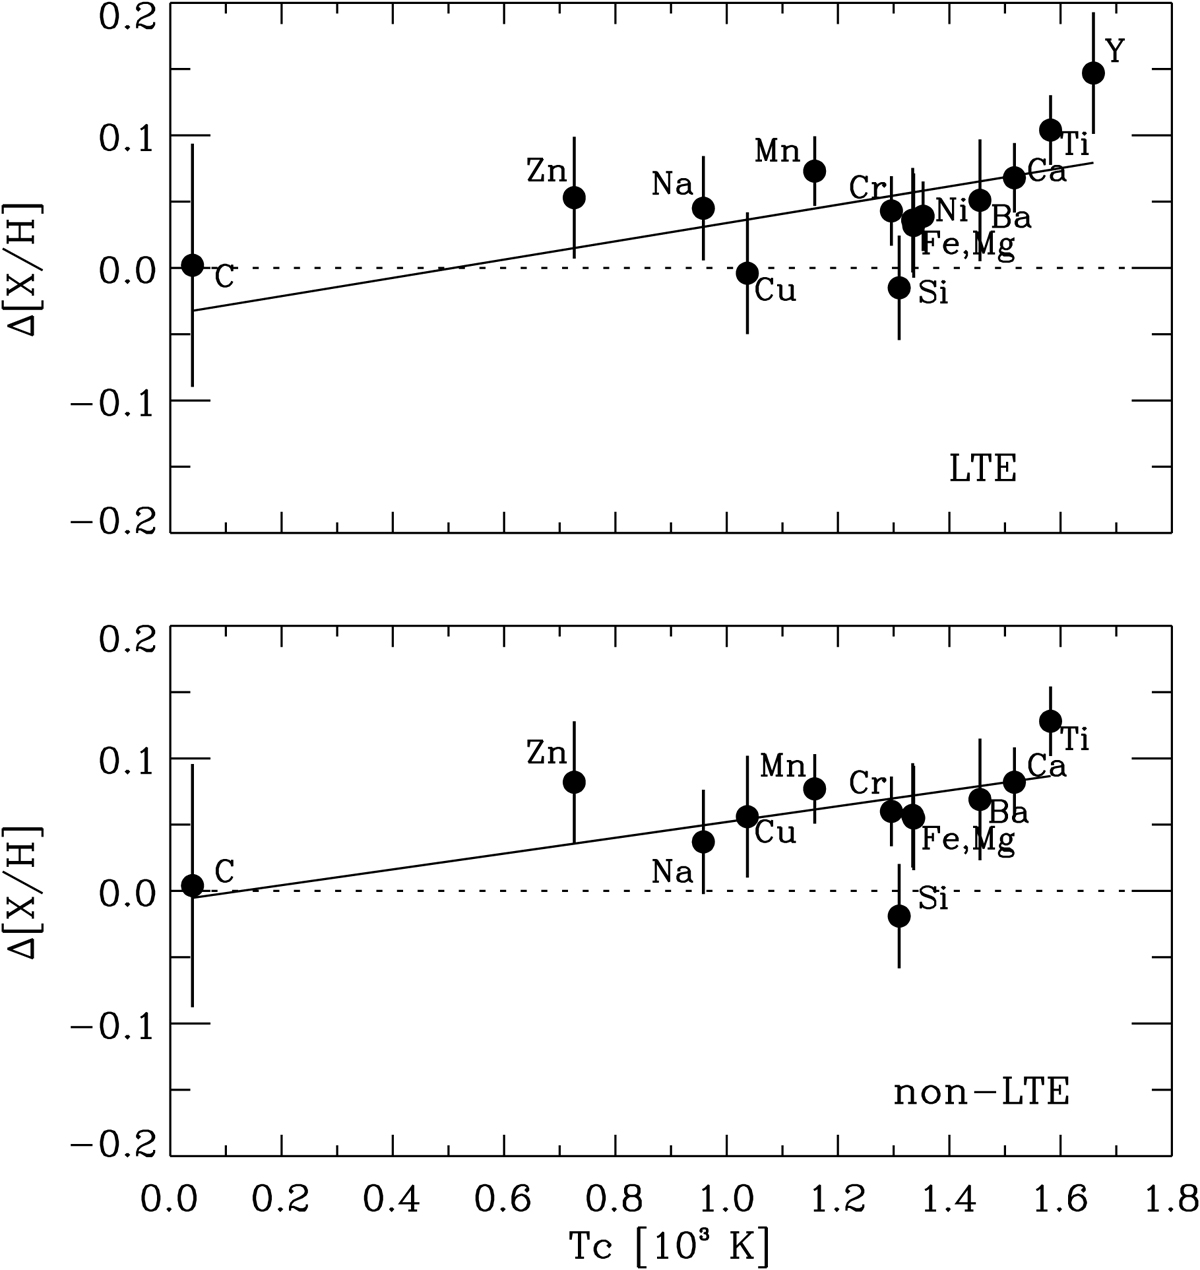
Difference in [X/H] between G 112-43 and G 112-44 as a function of elemental condensation temperature. The upper panel refers to LTE abundances, whereas non-LTE corrections from Table 3 have been applied in the lower panel. The solid lines correspond to the fits of the data given in Eqs. (1) and (2).
Current usage metrics show cumulative count of Article Views (full-text article views including HTML views, PDF and ePub downloads, according to the available data) and Abstracts Views on Vision4Press platform.
Data correspond to usage on the plateform after 2015. The current usage metrics is available 48-96 hours after online publication and is updated daily on week days.
Initial download of the metrics may take a while.