Fig. 20.
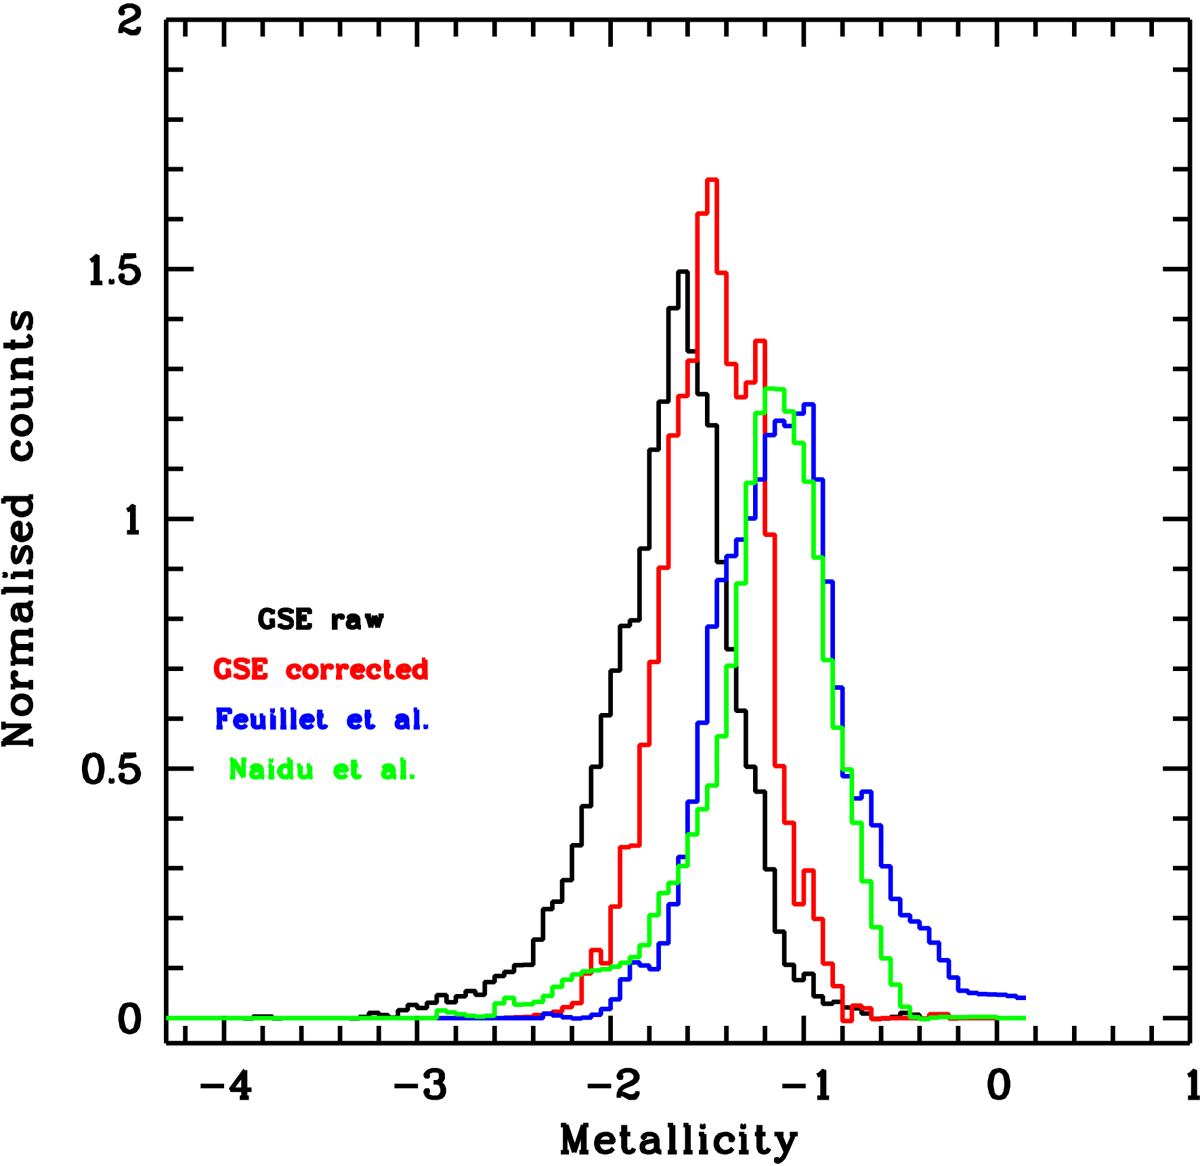
Observed metallicity histogram of GSE, for the whole sample (black), and the bias-corrected histogram (red). The histogram of Feuillet et al. (2020) is shown in blue, while that of Naidu et al. (2020) is shown in green.
Current usage metrics show cumulative count of Article Views (full-text article views including HTML views, PDF and ePub downloads, according to the available data) and Abstracts Views on Vision4Press platform.
Data correspond to usage on the plateform after 2015. The current usage metrics is available 48-96 hours after online publication and is updated daily on week days.
Initial download of the metrics may take a while.