Fig. 19.
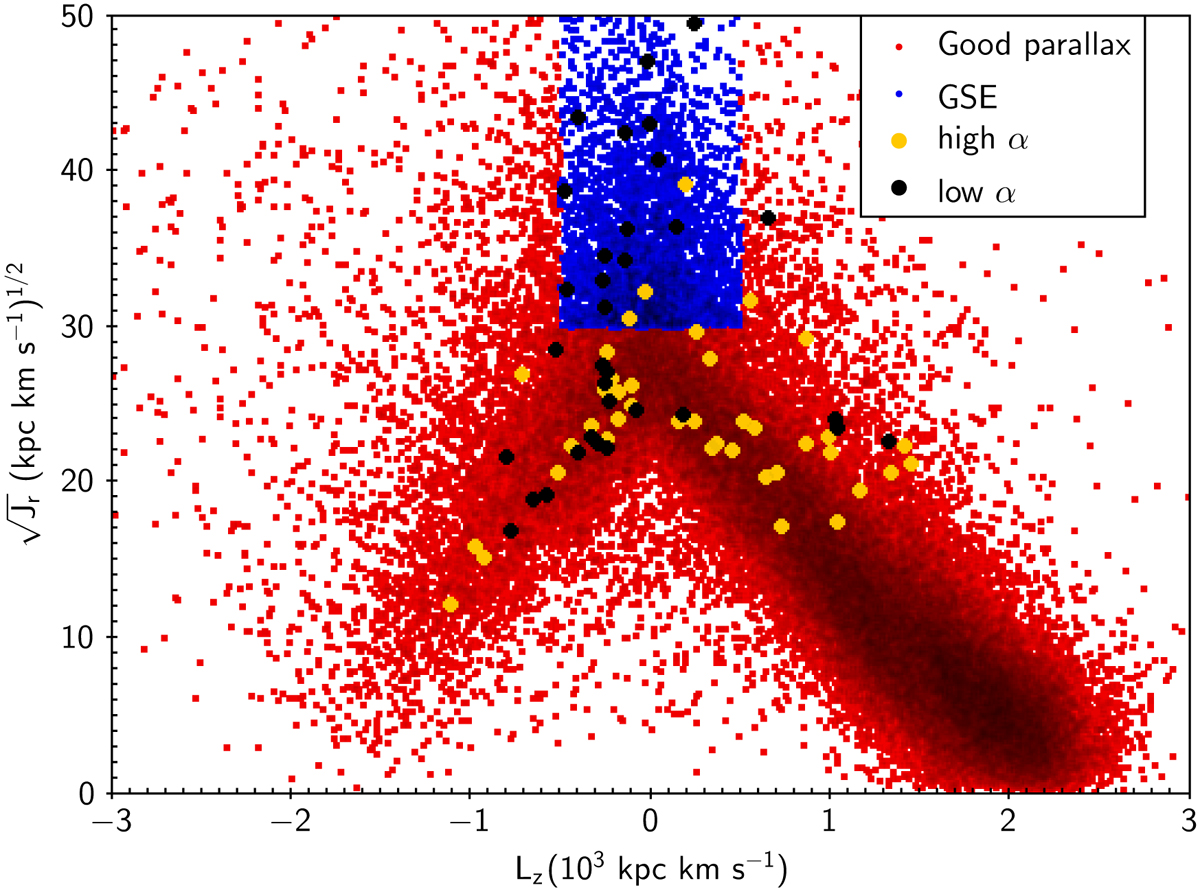
Diagram of angular momenta and square root of the radial action. Our good parallax sample is shown via red dots, the blue rectangle is the GSE selection proposed by Feuillet et al. (2020), the yellow dots are the high-α stars of Nissen & Schuster (2010), while the black dots are their low-α stars.
Current usage metrics show cumulative count of Article Views (full-text article views including HTML views, PDF and ePub downloads, according to the available data) and Abstracts Views on Vision4Press platform.
Data correspond to usage on the plateform after 2015. The current usage metrics is available 48-96 hours after online publication and is updated daily on week days.
Initial download of the metrics may take a while.