Fig. 1.
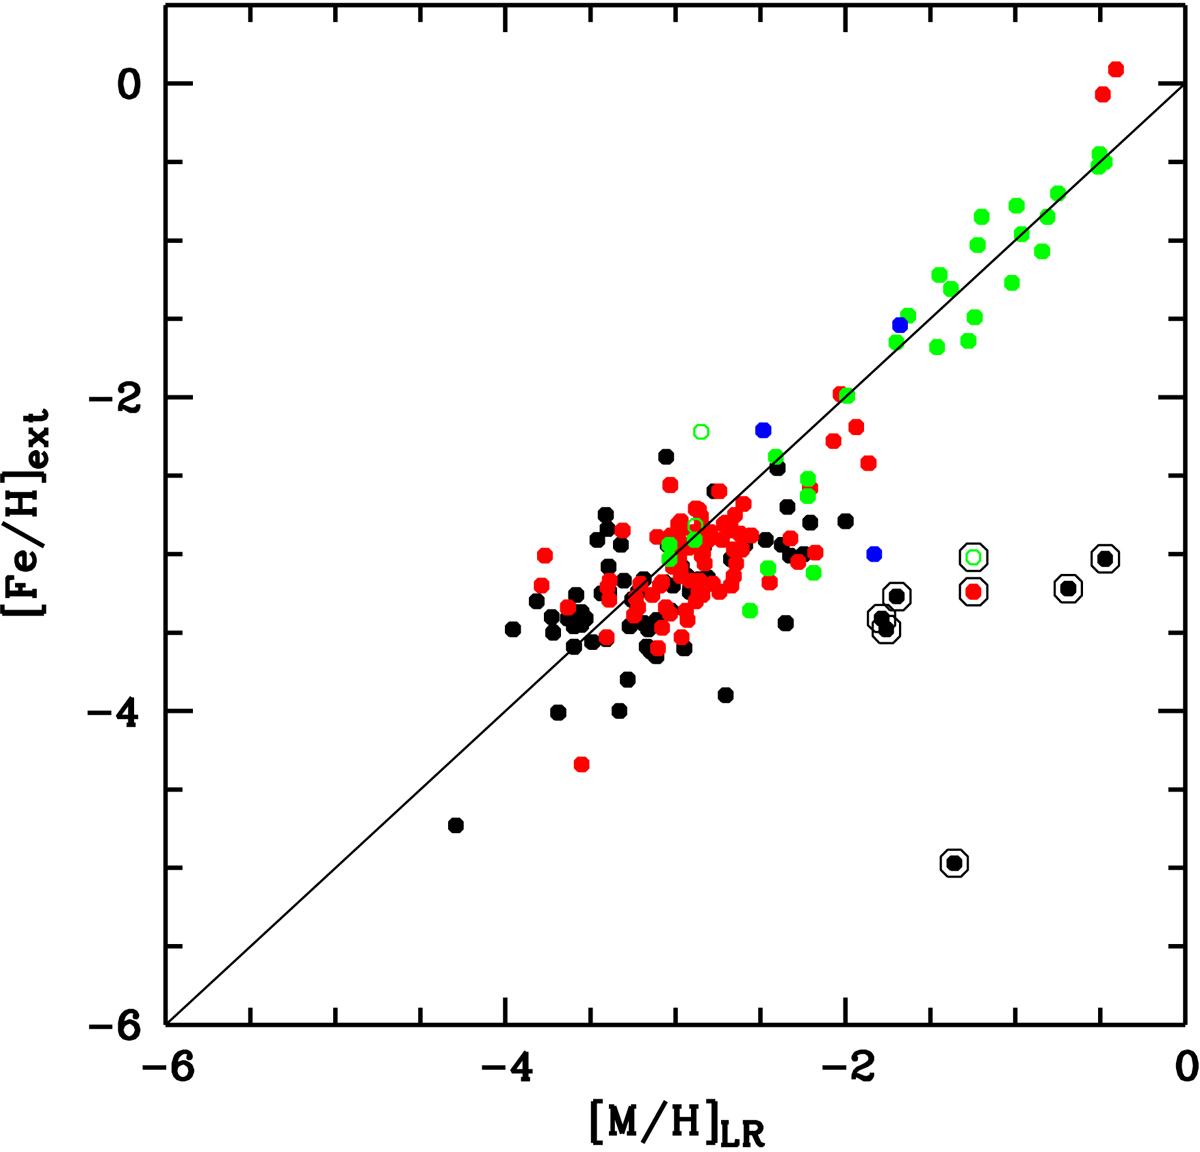
Metallicities derived from SDSS spectra (LR) compared to those of independent analysis of the same stars (ext). The black dots are the TOPoS sample (see text); the data are provided in Table B.1. The red dots are the PASTEL sample (see text); the data is provided in Table B.2. The green dots are data from Caffau et al. (2018), and open symbols are stars with uncertain abundance according to Caffau et al. (2018). The blue dots are data from Caffau et al. (2020). The stars circled in black are removed from the average (see text).
Current usage metrics show cumulative count of Article Views (full-text article views including HTML views, PDF and ePub downloads, according to the available data) and Abstracts Views on Vision4Press platform.
Data correspond to usage on the plateform after 2015. The current usage metrics is available 48-96 hours after online publication and is updated daily on week days.
Initial download of the metrics may take a while.