Fig. 9
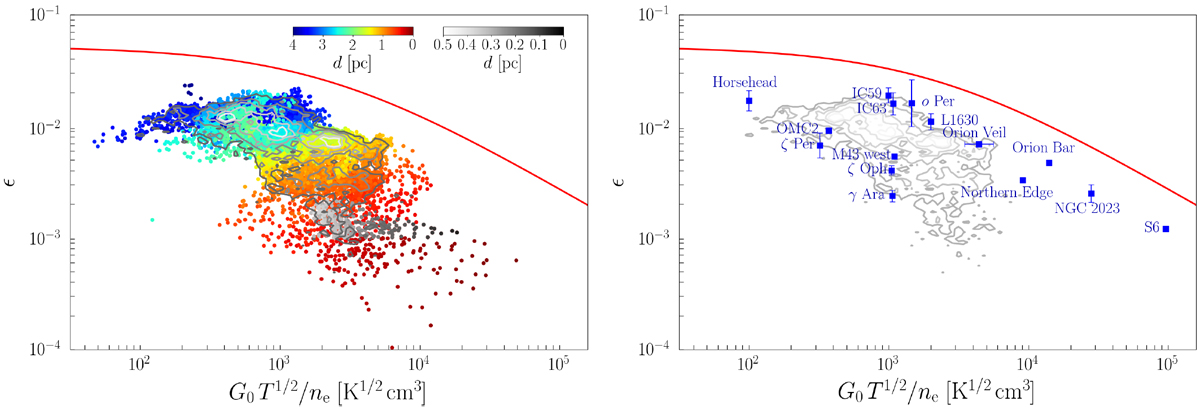
Left: photoelectric heating efficiency, equated with the cooling efficiency [C II]/FIR, throughout the Orion Nebula as function of the ionization parameter γ = G0 T1∕2∕ne. Color scales indicate the distance from θ1 Ori C. Contours indicate the density levels above which 90, 70, 50, 30 and 10% (from light to dark gray) of the points lie. The red curve is the theoretical prediction of Eq. (43) by Bakes & Tielens (1994). Right: photoelectric heating efficiency ϵ in PDRs and diffuse sight lines, equated as the cooling efficiency by [C II] and [O I] cooling, overlaid on contours from the left-hand panel. Data for the diffuse ISM are taken from Gry et al. (1992) and van Dishoeck & Black (1986), data of NGC 2023 are from Hollenbach & Tielens (1999), data for the Horsehead and L1630 are from Pabst et al. (2017), data for IC 59 and IC 63 are from Andrews et al. (2018), data for the Orion Bar, S6, M 43 west, and OMC2 are from Herrmann et al. (1997), and data for the Orion Veil are from Salas et al. (2019).
Current usage metrics show cumulative count of Article Views (full-text article views including HTML views, PDF and ePub downloads, according to the available data) and Abstracts Views on Vision4Press platform.
Data correspond to usage on the plateform after 2015. The current usage metrics is available 48-96 hours after online publication and is updated daily on week days.
Initial download of the metrics may take a while.