Fig. 2
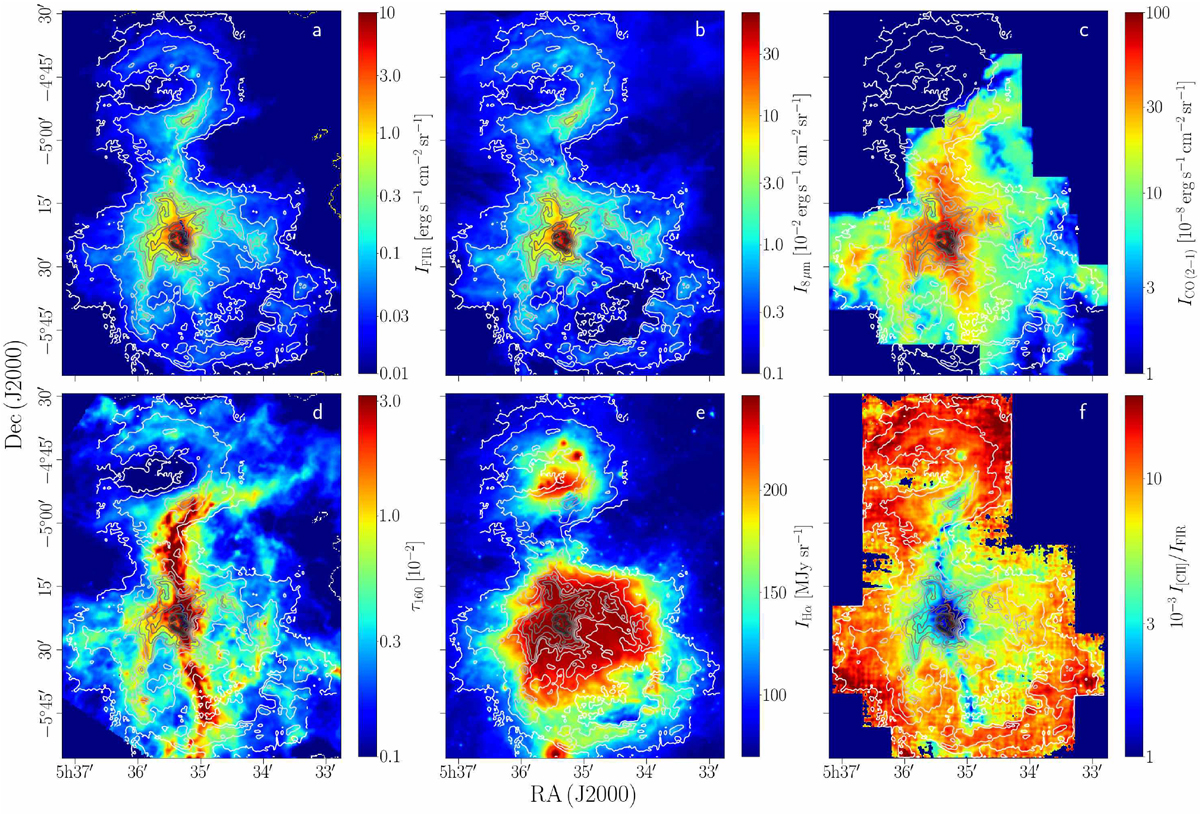
Various gas and dust tracers with [C II] line-integrated intensity (vLSR = −10−20 km s−1) in contours (from white to black: 1.5, 3.5, 7.0, 10.5, 14.0, 20.0, 30.0, 40.0, 50.0, 60.0 × 10⁻⁴ erg s−1 cm−2 sr−1): (a) FIR intensity, (b) IRAC 8 μm intensity, (c)IRAM 30 m CO(2–1) intensity, (d) dust optical depth τ160, (e) DSS-2 red-band intensity converted to Hα intensity, (f) [C II]/FIR ratio. All images are convolved to the resolution of the FIR intensity image (36′′). We note that the DSS-2 red band/Hα image (panele) is saturated at IHα ≃ 250 MJy sr−1.
Current usage metrics show cumulative count of Article Views (full-text article views including HTML views, PDF and ePub downloads, according to the available data) and Abstracts Views on Vision4Press platform.
Data correspond to usage on the plateform after 2015. The current usage metrics is available 48-96 hours after online publication and is updated daily on week days.
Initial download of the metrics may take a while.