Free Access
Fig. 10
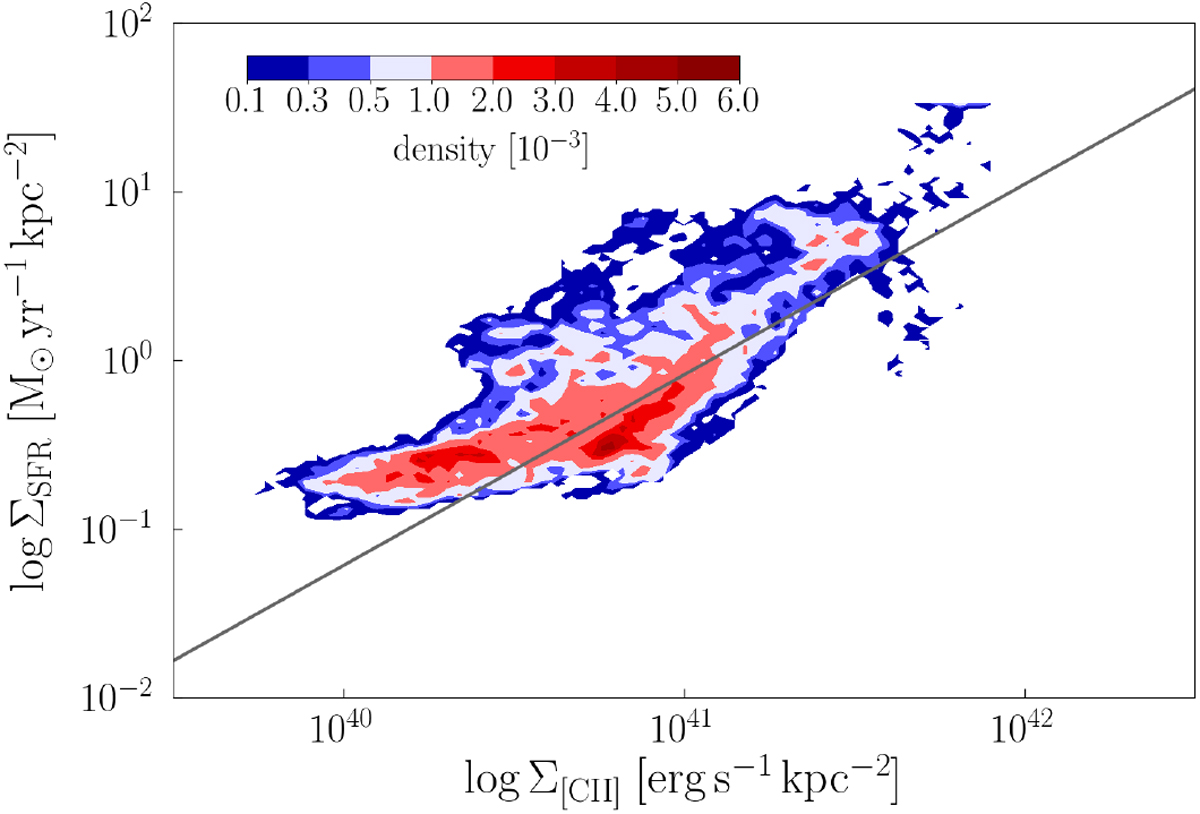
SFR surface density, estimated from Hα and 24 μm emission (Calzetti et al. 2007) versus the [C II] luminosity per unit area in Orion A as point-density plot. The gray line indicates the relation calibrated by Herrera-Camus et al. (2015) from a sample of local galaxies.
Current usage metrics show cumulative count of Article Views (full-text article views including HTML views, PDF and ePub downloads, according to the available data) and Abstracts Views on Vision4Press platform.
Data correspond to usage on the plateform after 2015. The current usage metrics is available 48-96 hours after online publication and is updated daily on week days.
Initial download of the metrics may take a while.