Free Access
Fig. 1.
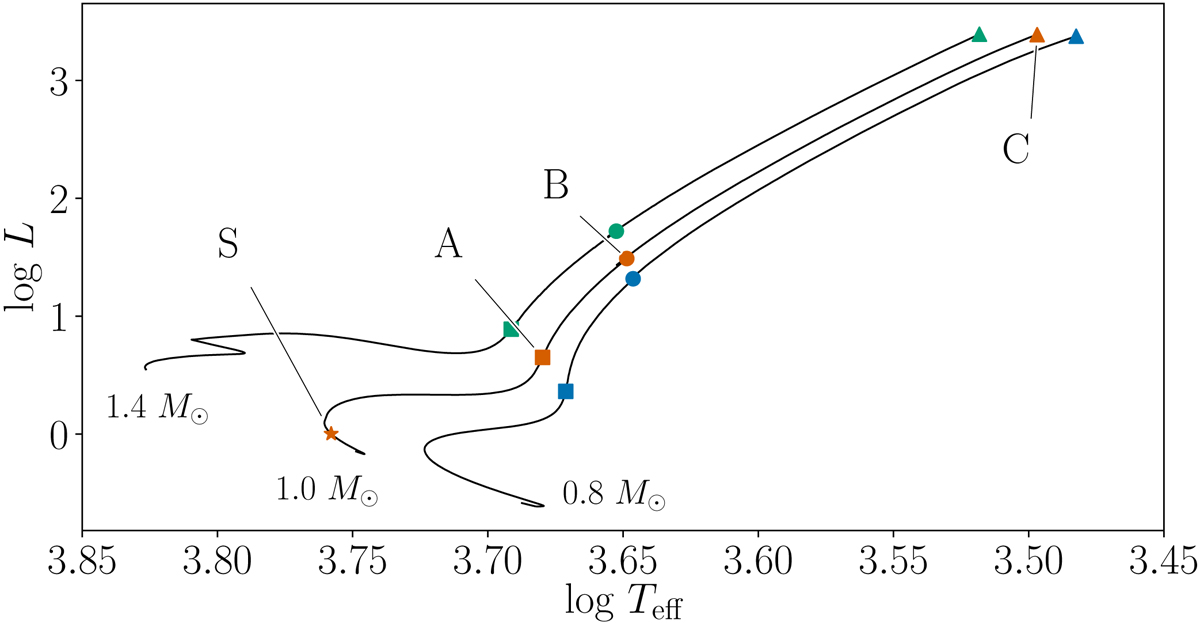
HR diagram with the evolution of M = 0.8, 1.0 and 1.4 M⊙ stars starting from the ZAMS up to the TRGB. Relevant benchmark models (S, A, B, and C) are marked in the evolution tracks (see text for more details).
Current usage metrics show cumulative count of Article Views (full-text article views including HTML views, PDF and ePub downloads, according to the available data) and Abstracts Views on Vision4Press platform.
Data correspond to usage on the plateform after 2015. The current usage metrics is available 48-96 hours after online publication and is updated daily on week days.
Initial download of the metrics may take a while.