Fig. 8
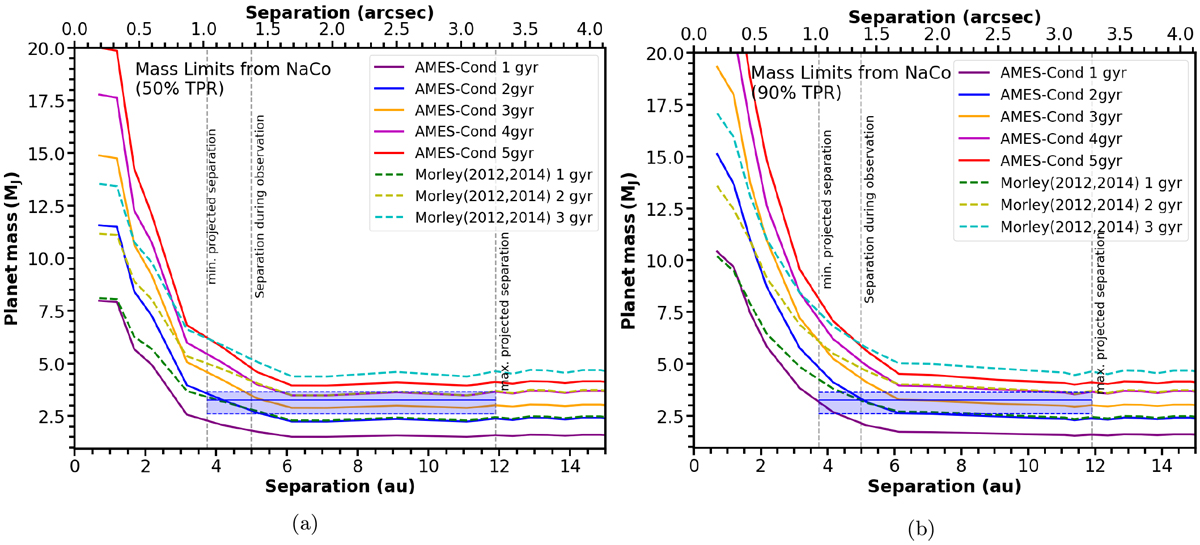
Predicted 5σ temperaturelimits for NEAR magnitudes as a function of increasing distance from the central star. The limits derived from AMES-Cond atmospheric and evolutionary grids is shown as solid purple line and the limits from Morley et al. (2012, 2014) atmospheric models is shown as solid green line. The age assumed for the above limits is 5 Gyr. The dashed black lines have the same meaning as in the previous figures.
Current usage metrics show cumulative count of Article Views (full-text article views including HTML views, PDF and ePub downloads, according to the available data) and Abstracts Views on Vision4Press platform.
Data correspond to usage on the plateform after 2015. The current usage metrics is available 48-96 hours after online publication and is updated daily on week days.
Initial download of the metrics may take a while.