Fig. 7
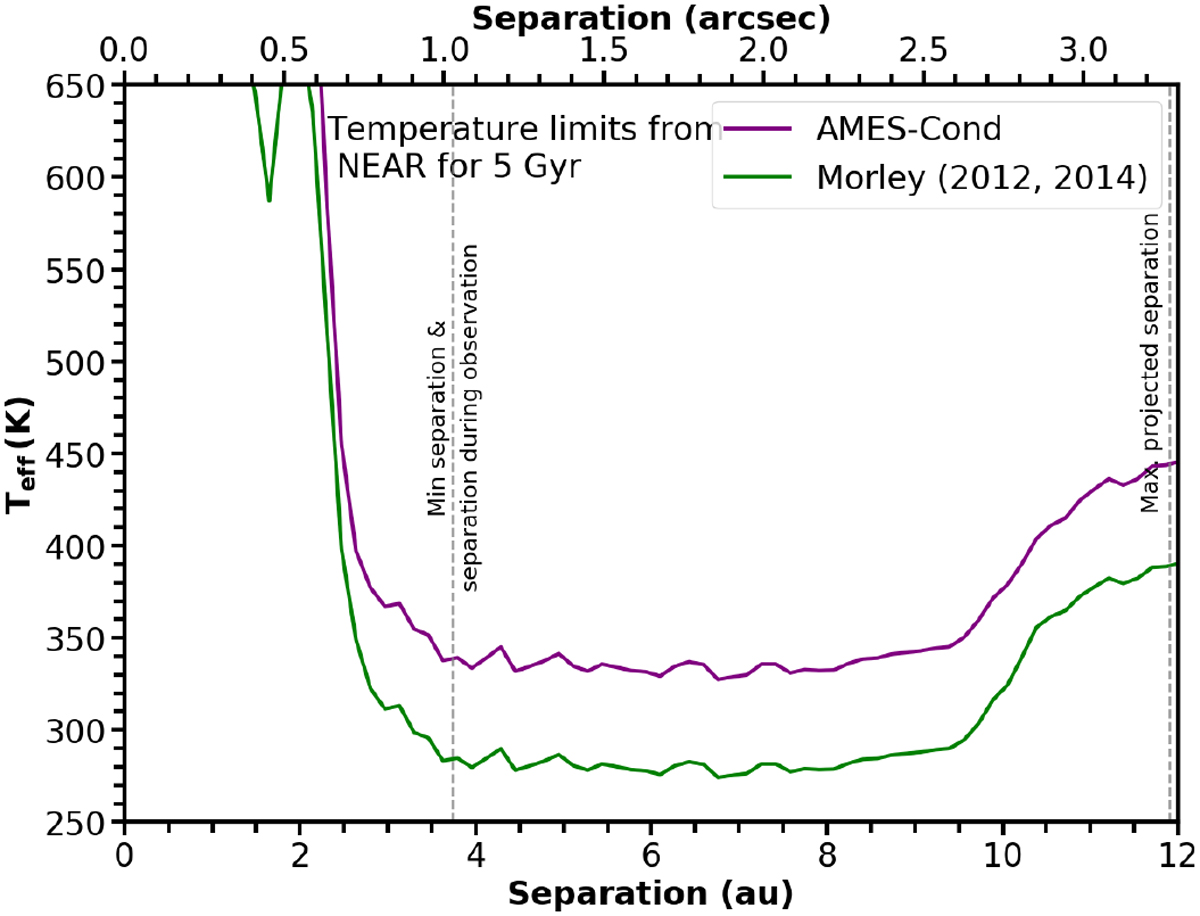
5σ upper mass limits for ϵ Ind Ab derived from observations with NaCo L′, reduced at a TPR of 50 (panel a) and 90% (panel b), for different age assumptions. The solid lines represent limits obtained from AMES-Cond atmospheric and evolutionary grids and the dashed lines represent the limits from Morley et al. (2012, 2014) atmospheric models, coupled with the evolutionary track from AMES-Cond grids. The solid blue line represents the companion mass predicted from Feng et al. (2019) at an inclination of
![]() , with the associated region of uncertainty in mass shown as the filled region between the blue dashed lines. The dashed black lines have the same meaning as in the previous figures.
, with the associated region of uncertainty in mass shown as the filled region between the blue dashed lines. The dashed black lines have the same meaning as in the previous figures.
Current usage metrics show cumulative count of Article Views (full-text article views including HTML views, PDF and ePub downloads, according to the available data) and Abstracts Views on Vision4Press platform.
Data correspond to usage on the plateform after 2015. The current usage metrics is available 48-96 hours after online publication and is updated daily on week days.
Initial download of the metrics may take a while.