Fig. 3
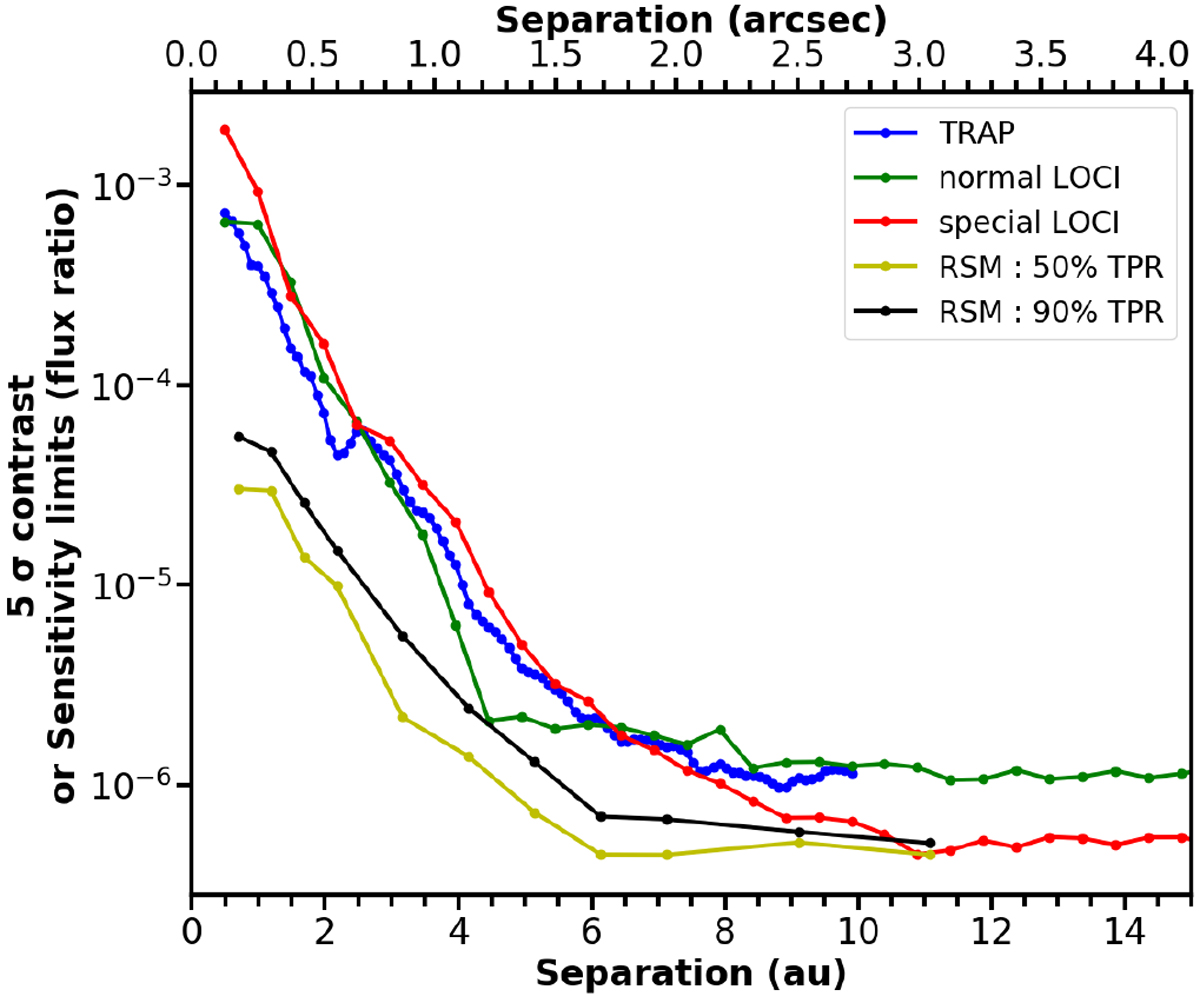
Contrast curves resulting from the different reduction algorithms applied to NaCo L′ observationsin this work. The y-axis shows the 5σ contrast limits obtained from TRAP, the normal LOCI, and modified LOCI subtraction techniques (shown as blue, green, and red dotted line), and the equivalent flux ratio or sensitivity limits obtained using RSM algorithm at 50 and 90% TPR as yellow and black dotted lines, respectively.
Current usage metrics show cumulative count of Article Views (full-text article views including HTML views, PDF and ePub downloads, according to the available data) and Abstracts Views on Vision4Press platform.
Data correspond to usage on the plateform after 2015. The current usage metrics is available 48-96 hours after online publication and is updated daily on week days.
Initial download of the metrics may take a while.