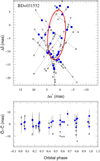
Fig. B.6
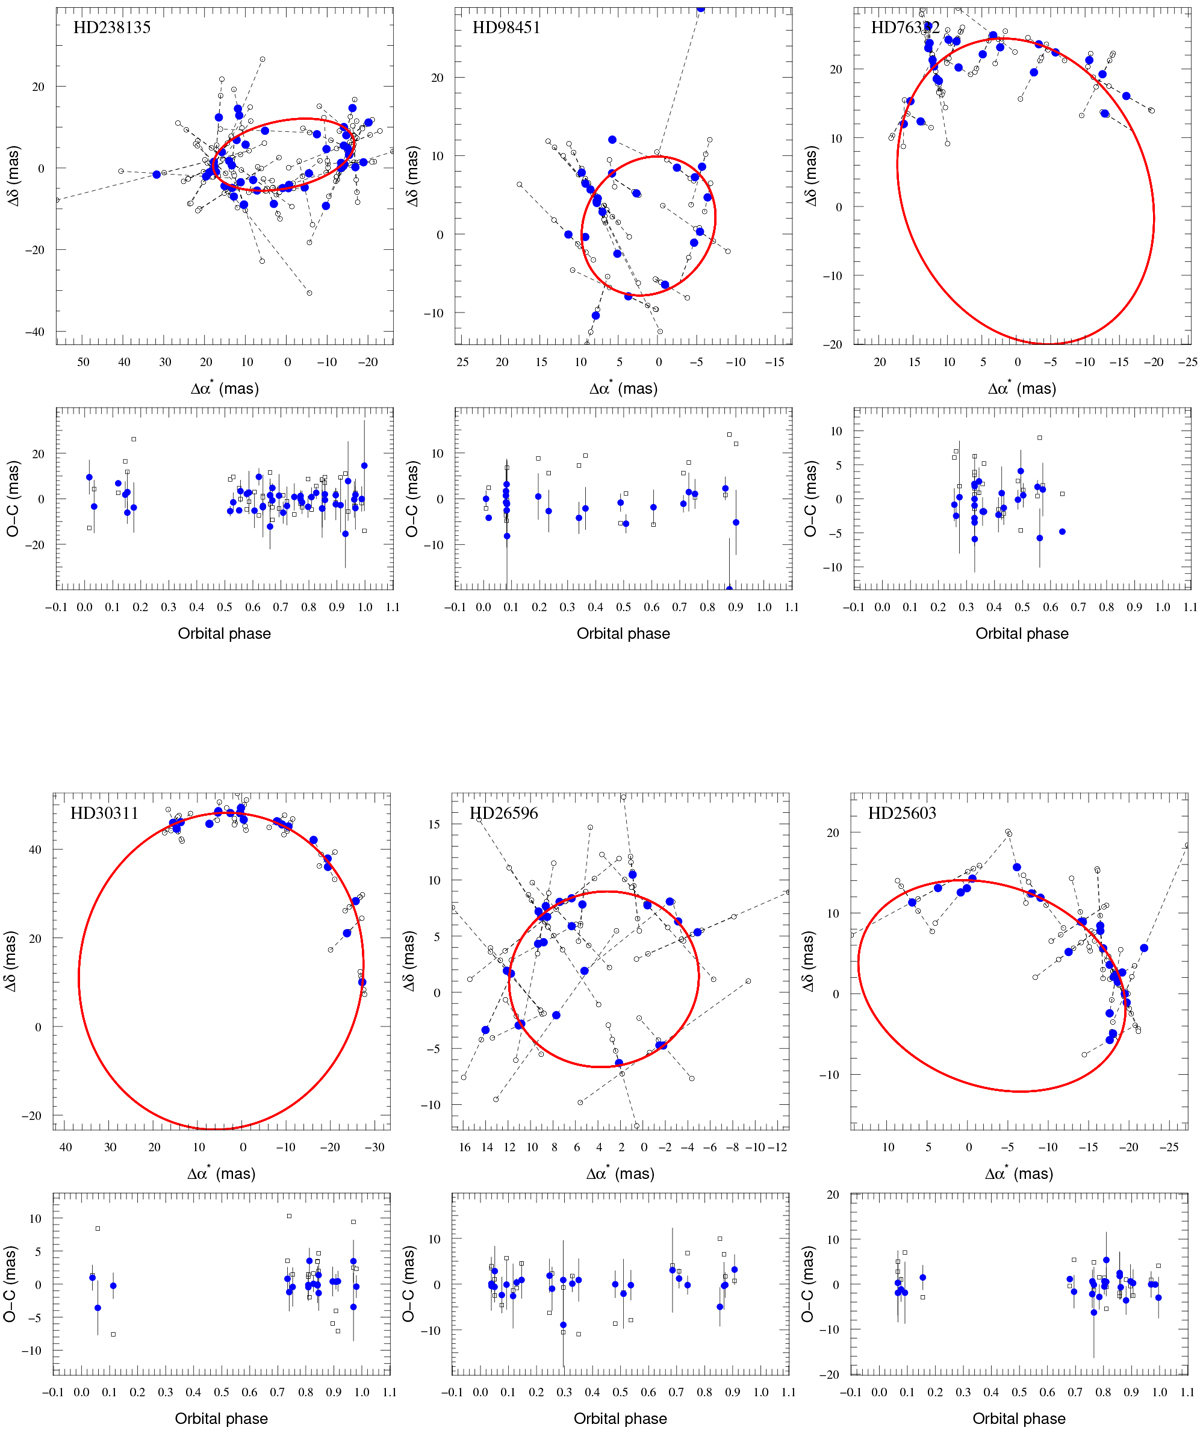
Top panels: astrometric orbits of 3σ detections projected on the sky. North is up and east is left. The solid red line shows the model orbit and open circles mark the individual HIPPARCOS measurements. Bottom panels: O–C residuals for the normal points of the orbital solution (filled blue circles) and of the five-parameter model without companion (open squares).
Current usage metrics show cumulative count of Article Views (full-text article views including HTML views, PDF and ePub downloads, according to the available data) and Abstracts Views on Vision4Press platform.
Data correspond to usage on the plateform after 2015. The current usage metrics is available 48-96 hours after online publication and is updated daily on week days.
Initial download of the metrics may take a while.