Fig. 3.
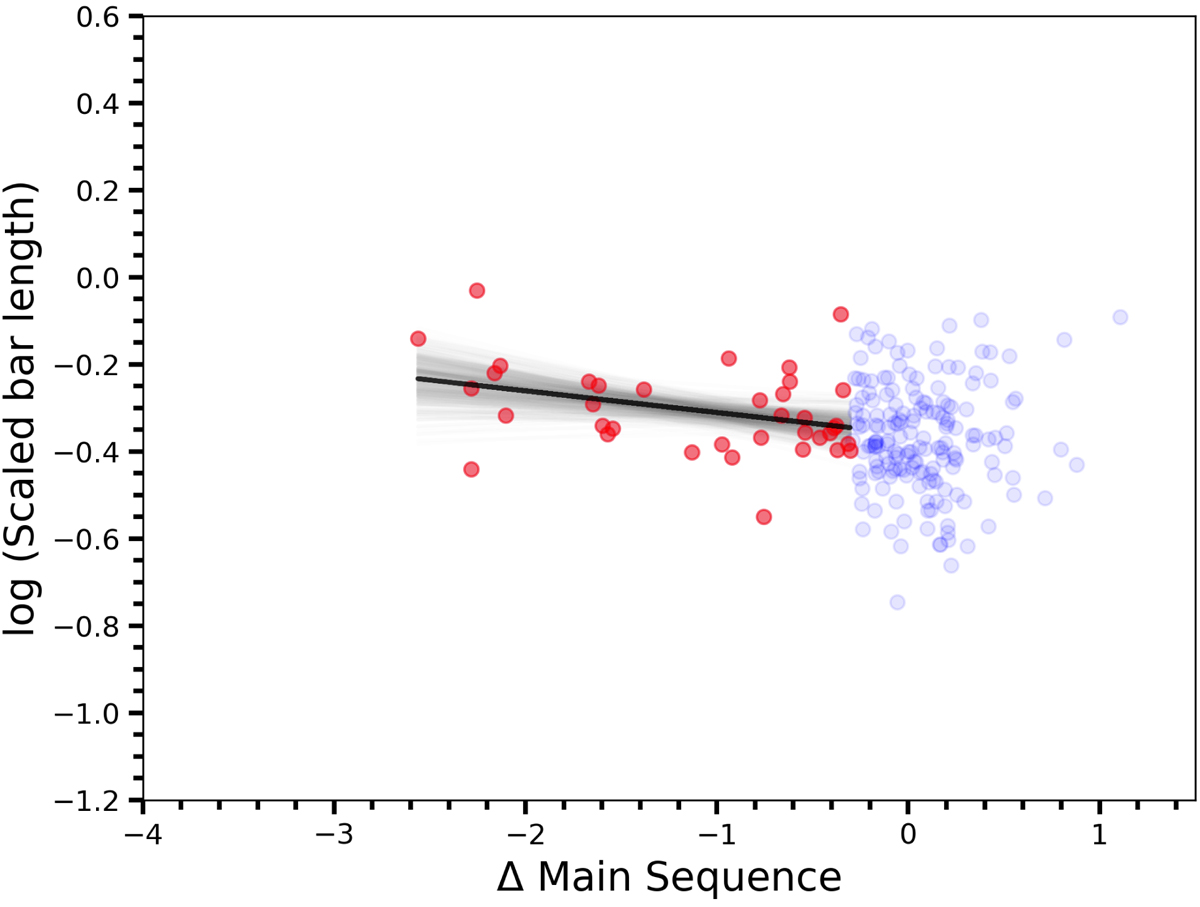
Offset of 210 isolated barred galaxies from the main sequence relation derived using GSWLC plotted against scaled bar length. Here the number of data points is limited and hence instead of binning the data we bootstrapped the data with confidence intervals shown in grey and the best-fit relation shown in black. The passive population of galaxies below the main sequence is shown in red. Galaxies on and above the relation are shown in blue.
Current usage metrics show cumulative count of Article Views (full-text article views including HTML views, PDF and ePub downloads, according to the available data) and Abstracts Views on Vision4Press platform.
Data correspond to usage on the plateform after 2015. The current usage metrics is available 48-96 hours after online publication and is updated daily on week days.
Initial download of the metrics may take a while.