Fig. 2.
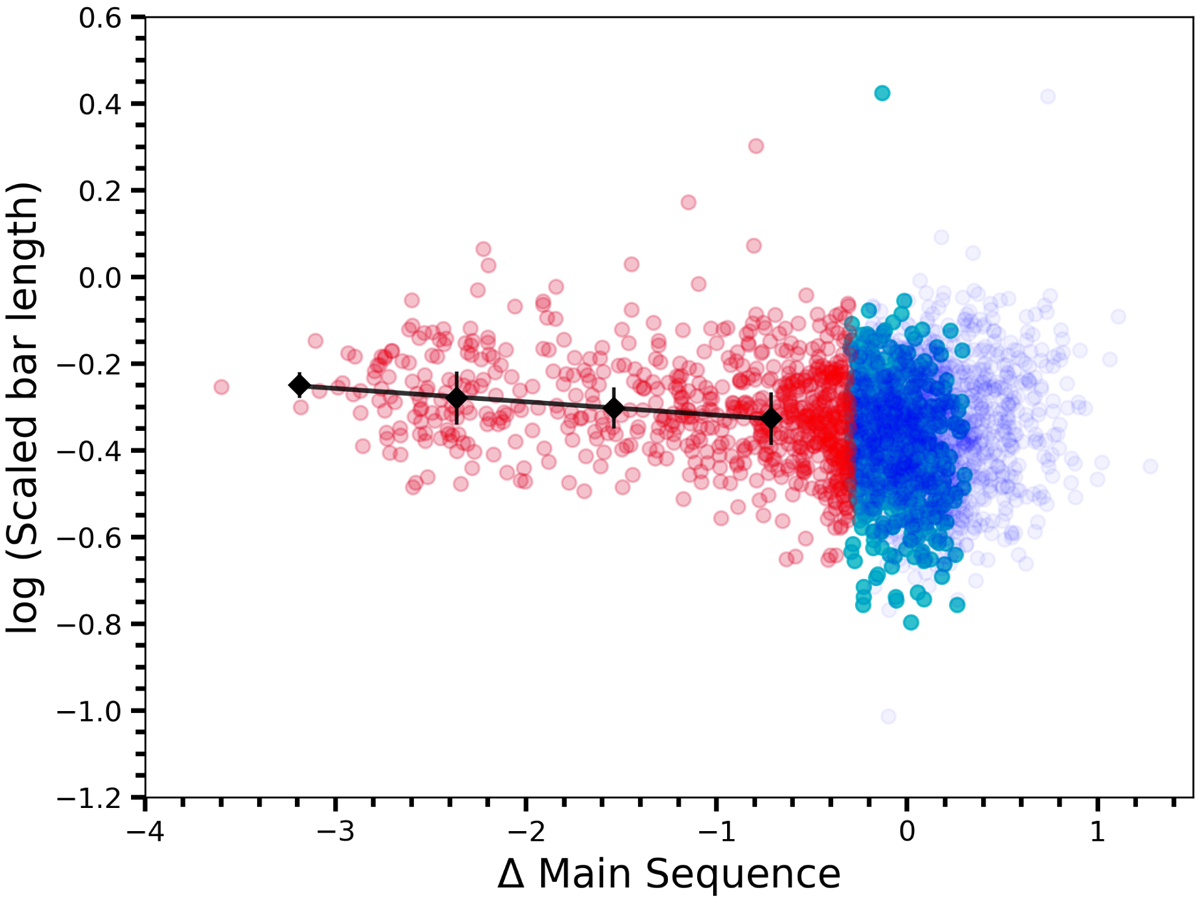
Offset of galaxies from the main sequence relation derived from GSWLC plotted against scaled bar length. The offset of barred galaxies are grouped into four bins so that a possible trend can be investigated. The median value of scaled bar length in each bin is shown with black diamond points with error bars. The best-fit relation for binned points is shown with a black line. The passive population of galaxies 0.3 dex below the main sequence is shown in red. Galaxies on the main sequence and 0.3 dex above the relation are shown in blue. The 651 galaxies that are passive in MPA-JHU but are on the main sequence in GSWLC are shown in cyan.
Current usage metrics show cumulative count of Article Views (full-text article views including HTML views, PDF and ePub downloads, according to the available data) and Abstracts Views on Vision4Press platform.
Data correspond to usage on the plateform after 2015. The current usage metrics is available 48-96 hours after online publication and is updated daily on week days.
Initial download of the metrics may take a while.