Fig. 1.
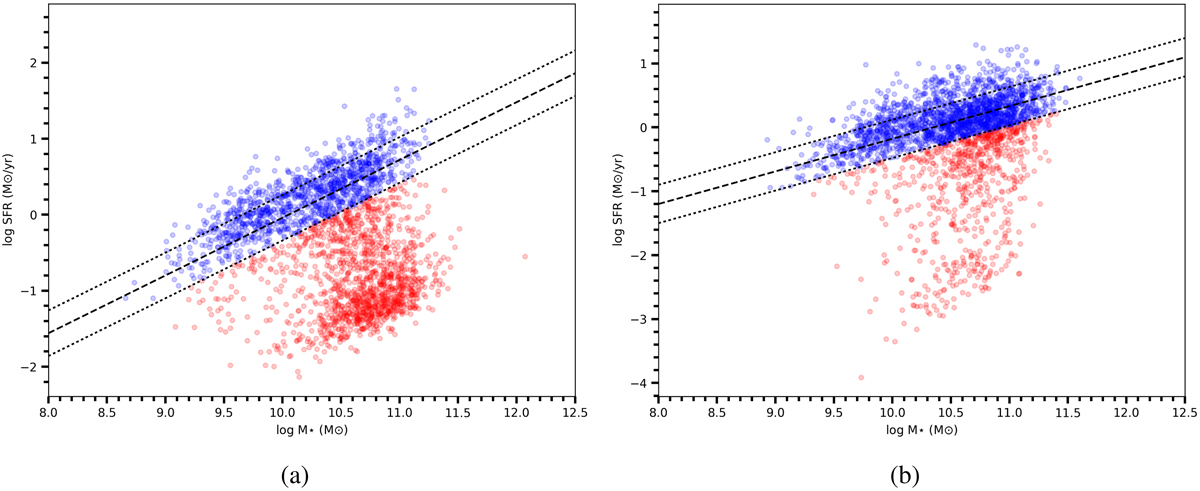
Panel a: SFR−M⋆ relation for barred galaxies using data from the MPA-JHU catalogue. Panel b: SFR−M⋆ relation for barred galaxies using data from GSWLC. The galaxies that are on the main sequence in both SFR−M⋆ relations are shown in blue and the passive galaxies are shown in red. The main sequence relation is shown with the black dotted line and the 0.3 dex width on either side of main sequence is shown with a dashed line. The colour scheme in Fig. 1b is the same as in Fig. 1a.
Current usage metrics show cumulative count of Article Views (full-text article views including HTML views, PDF and ePub downloads, according to the available data) and Abstracts Views on Vision4Press platform.
Data correspond to usage on the plateform after 2015. The current usage metrics is available 48-96 hours after online publication and is updated daily on week days.
Initial download of the metrics may take a while.