Fig. 6.
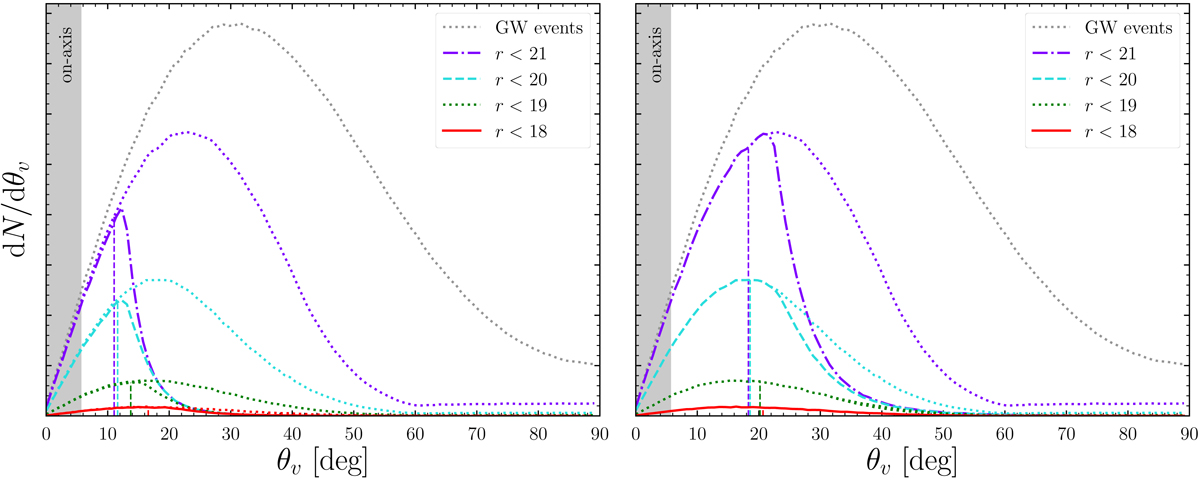
Distributions in viewing angle of the afterglows detectable in the radio band at three times the VLA threshold (45 μJy) following a GW-triggered kilonova detection with a limiting r-band magnitude of 18–21. The dotted lines represent the corresponding distributions for the kilonova sources, as in Fig. 3. In the left (resp. right) panel, a value φ = 1 (resp. φ = 10, corresponding to particularly energetic jets or dense circum-merger media) was adopted in Eq. (7).
Current usage metrics show cumulative count of Article Views (full-text article views including HTML views, PDF and ePub downloads, according to the available data) and Abstracts Views on Vision4Press platform.
Data correspond to usage on the plateform after 2015. The current usage metrics is available 48-96 hours after online publication and is updated daily on week days.
Initial download of the metrics may take a while.