Fig. 4.
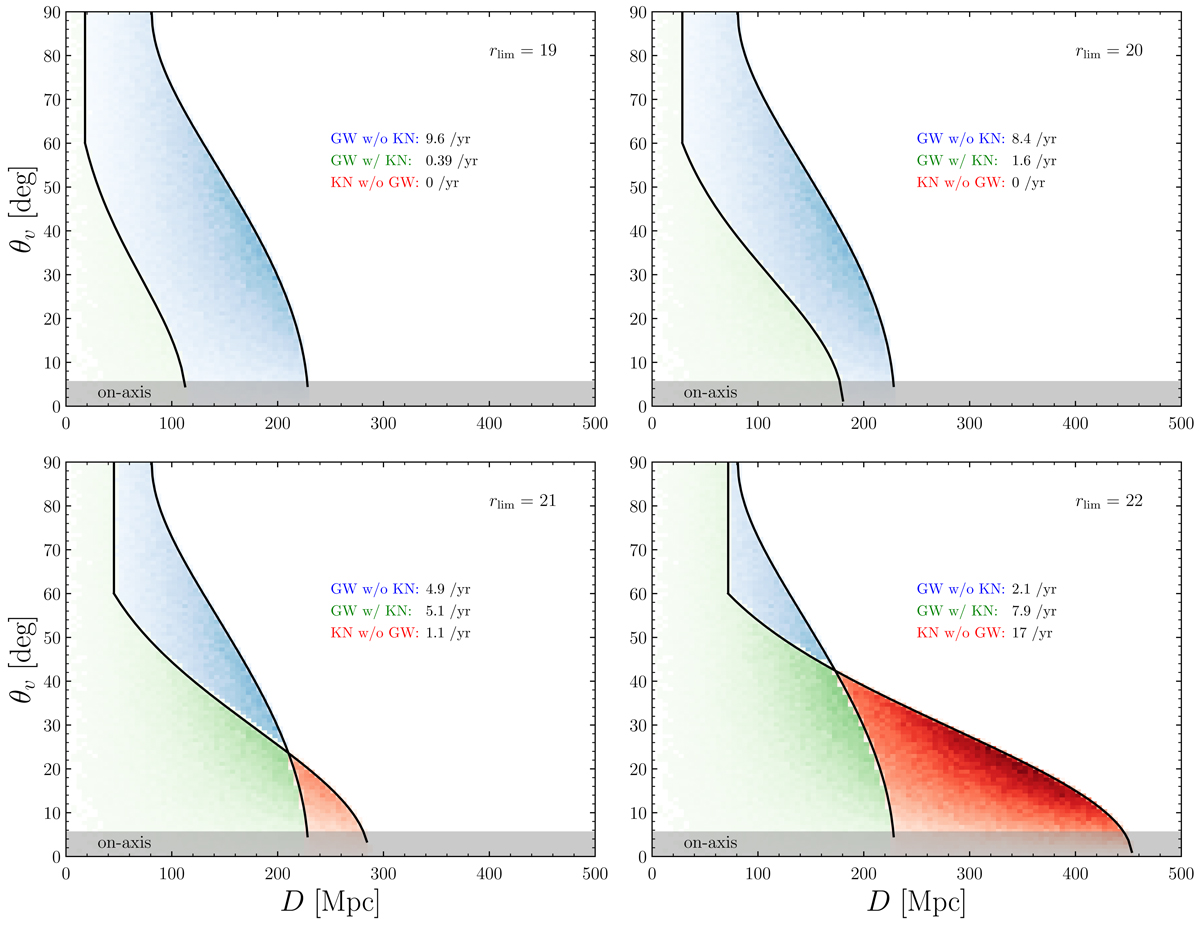
Relative occurrence rates of signals in the distance-viewing angle plane predicted for the O4 run. Colors indicate different detection scenarios: events detectable (i) both as GW triggers and kilonovae (green), (ii) as GW signals alone (blue), and (iii) only as kilonovae (“orphan kilonovae,” red). For the kilonova detection, the four diagrams correspond to the limiting r-band magnitudes from 19 to 22. We also indicate the total occurrence rates in each detection scenario, assuming a GW detection rate of 10 yr−1 for O4.
Current usage metrics show cumulative count of Article Views (full-text article views including HTML views, PDF and ePub downloads, according to the available data) and Abstracts Views on Vision4Press platform.
Data correspond to usage on the plateform after 2015. The current usage metrics is available 48-96 hours after online publication and is updated daily on week days.
Initial download of the metrics may take a while.