Fig. 2.
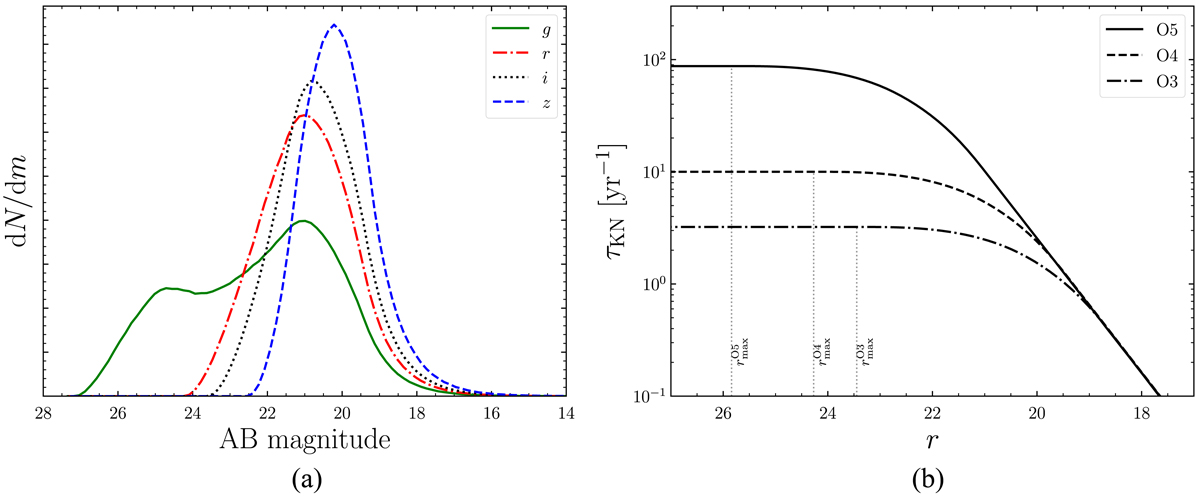
Distribution of peak kilonova magnitudes and kilonova detection rate as a function of threshold. Left: distribution of the peak AB magnitude in the g, r, i, and z bands predicted for kilonovae associated with GW triggers during O4. Right: rate of kilonovae brighter than a given r magnitude associated with GW detections during O3, O4, and O5, assuming a GW neutron star coalescence detection rate of τBNS, GW = 10 yr−1 for O4 (Abbott et al. 2020b). The bright end of the distribution (r < 19) is well fit by Eq. (6).
Current usage metrics show cumulative count of Article Views (full-text article views including HTML views, PDF and ePub downloads, according to the available data) and Abstracts Views on Vision4Press platform.
Data correspond to usage on the plateform after 2015. The current usage metrics is available 48-96 hours after online publication and is updated daily on week days.
Initial download of the metrics may take a while.