Fig. 3.
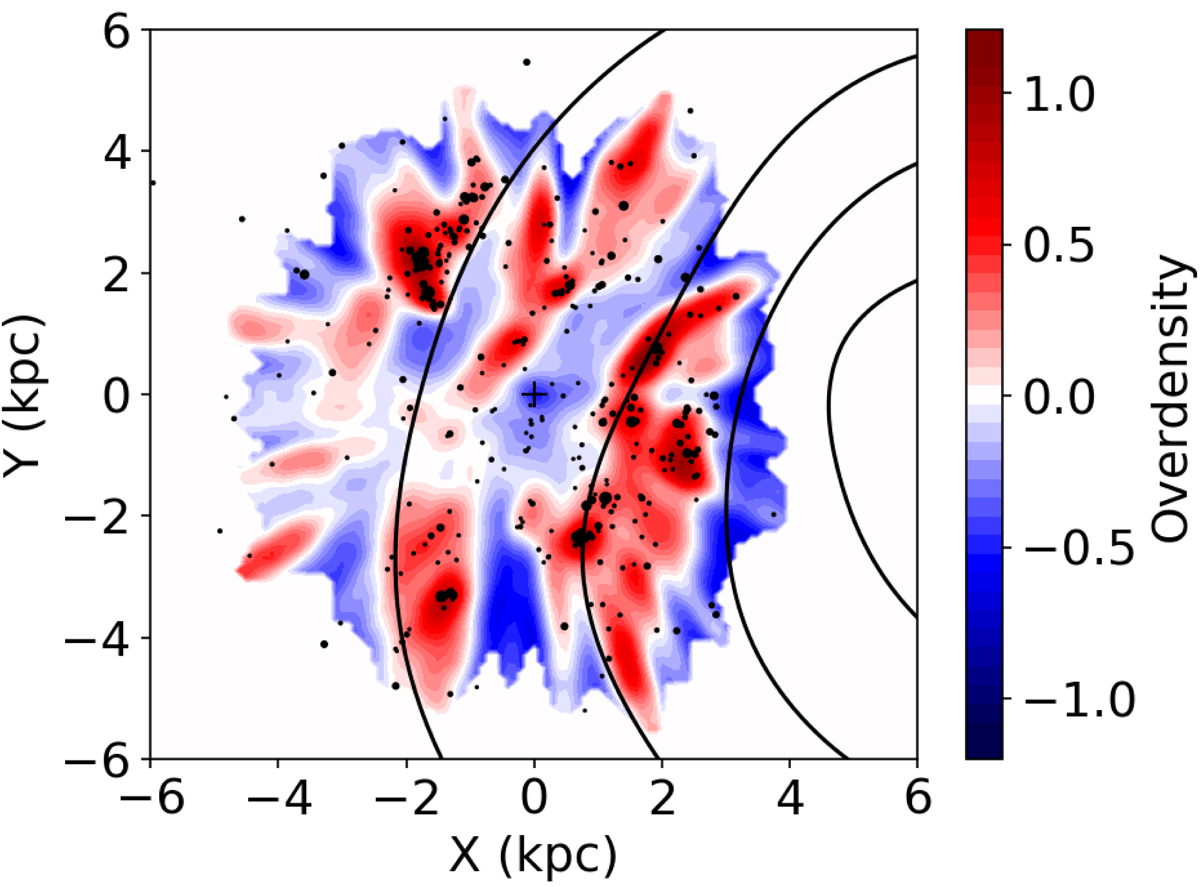
Same as Fig. 1b, but compared to the distribution of the young and instrinsically bright open clusters sample (see Sect. 2.2) shown by the black dots. The size of the dots is proportional to the number of cluster members brighter than absolute magnitude MG > 0 (see text). Solid lines show the spiral arm model of Taylor & Cordes (1993), which is based on HII regions.
Current usage metrics show cumulative count of Article Views (full-text article views including HTML views, PDF and ePub downloads, according to the available data) and Abstracts Views on Vision4Press platform.
Data correspond to usage on the plateform after 2015. The current usage metrics is available 48-96 hours after online publication and is updated daily on week days.
Initial download of the metrics may take a while.