Fig. 2.
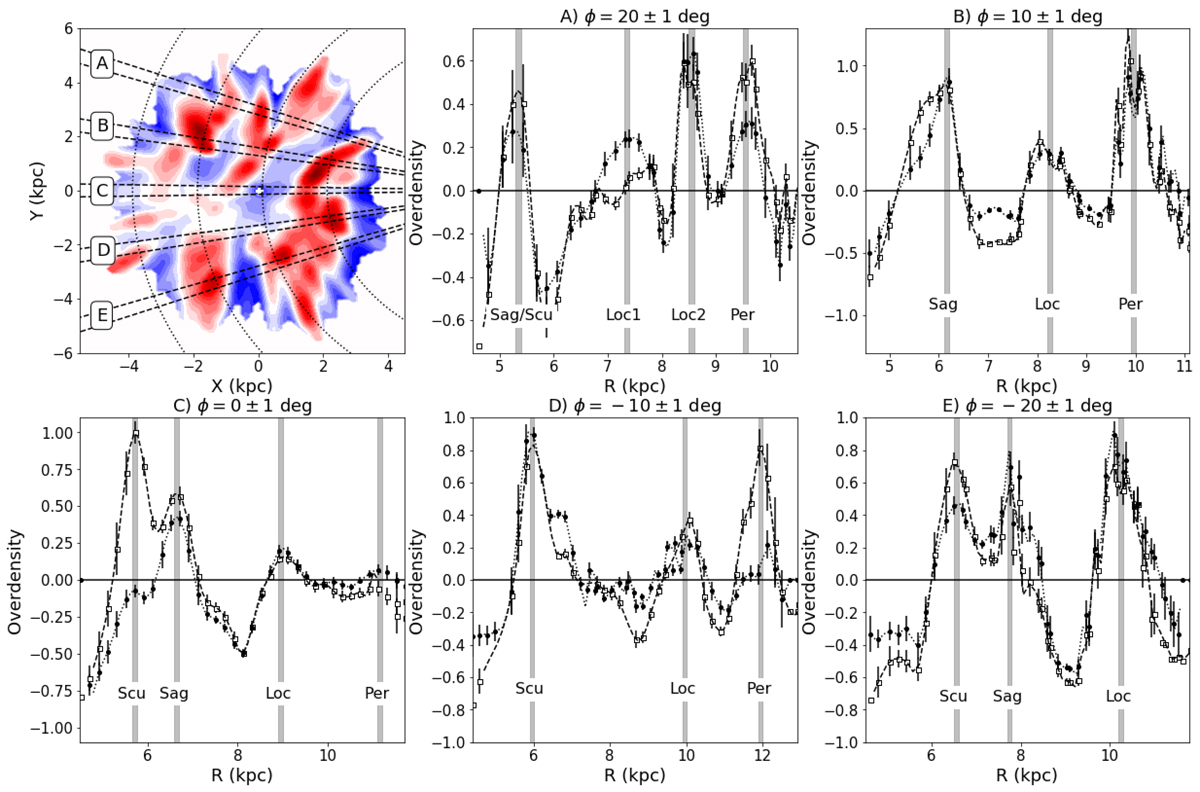
Top left panel: same as Fig. 1b, but with some geometric references superimposed. Dotted lines from left to right show the points with constant Galactocentric radius R = 12, 10, 8, 6 kpc, respectively. Dashed lines show the five selected slices (A,B,C,D,E), which are separated by 10 deg in Galactic azimuth ϕ and by 2 deg in width. Panels A to E: profile of the measured overdensity as a function of R for the UMS P18 sample (black dots) and the Z21 sample (white squares). Error bars show bootstrap uncertainties calculated as explained in Appendix B.3. For computational reasons, black dots/white squares and relative error bars were calculated for each slice and then connected using splines, as shown by the dotted (dashed) lines, to give a visual impression of how the overdensity varies at different radii. Each peak of the measured overdensity has been identified with a spiral arm in the Milky Way, as indicated by the vertical grey lines and the corresponding labels. The identification of each peak is not due to an assumed specific model, but is simply based on the geometric appearance of the top left panel (see text).
Current usage metrics show cumulative count of Article Views (full-text article views including HTML views, PDF and ePub downloads, according to the available data) and Abstracts Views on Vision4Press platform.
Data correspond to usage on the plateform after 2015. The current usage metrics is available 48-96 hours after online publication and is updated daily on week days.
Initial download of the metrics may take a while.