Fig. 1.
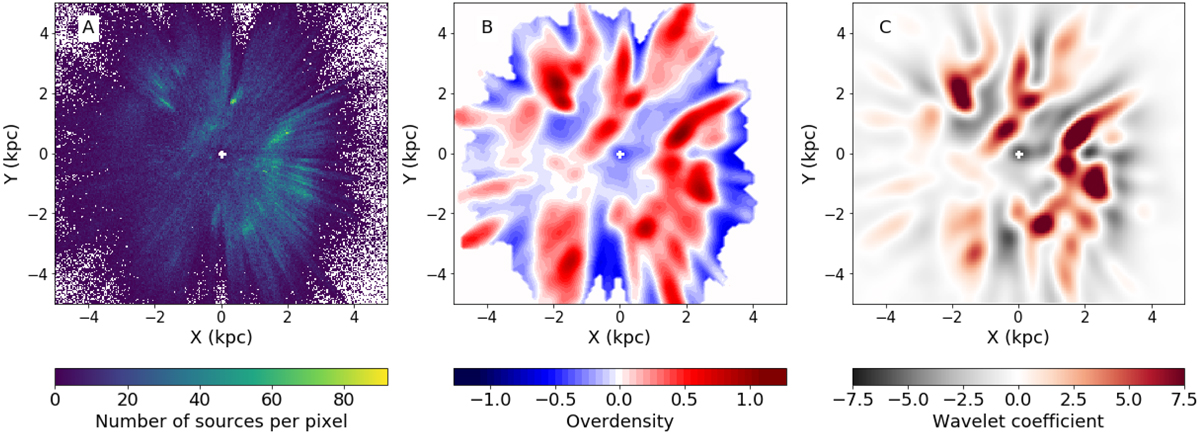
Panel A: face-on view of the UMS P18 data set in the Galactic disc. The position of the Sun is shown by the white cross in (X, Y) = (0, 0). The Galactic centre is to the right, at (X, Y) = (R⊙, 0), and the Galaxy is rotating clockwise. Panel B: same as panel A, but showing the measured overdensity using the UMS P18 data set, based on a local density scale length 0.3 kpc. Only points with Σ(x, y) > 0.003 are plotted in order to remove regions where the statistics is too low. The corresponding plot for the UMS Z21 sample can be found in Fig. B.1. Panel C: same as panel A, but showing the wavelet transformation at the scale 3 (size∼0.4 kpc). A different version of panels B and C using a larger scale length can be found in Fig. B.2. The maps shown in panels B and C are publicly available at https://github.com/epoggio/Spiral_arms_EDR3.git.
Current usage metrics show cumulative count of Article Views (full-text article views including HTML views, PDF and ePub downloads, according to the available data) and Abstracts Views on Vision4Press platform.
Data correspond to usage on the plateform after 2015. The current usage metrics is available 48-96 hours after online publication and is updated daily on week days.
Initial download of the metrics may take a while.