Fig. 7
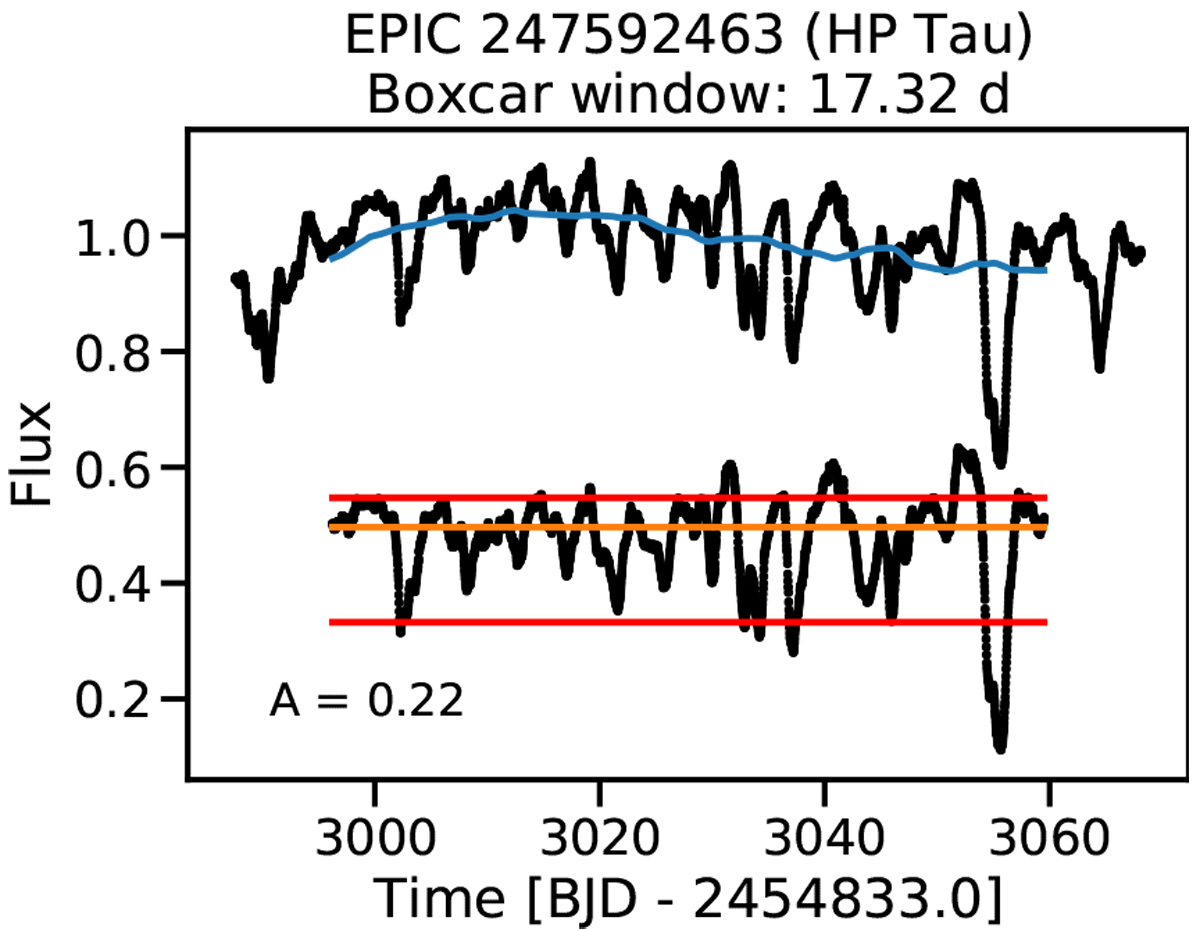
Determination of the dip amplitude with the example of HP Tau. Top: light-curve detrending of the original data (black) with a boxcar of size 4 ⋅ P. The blue line is the trend. Bottom: detrended light curve. The convolution with a boxcar removes a small part of the data at the edges. Orange line: flux median. Red lines: 90th and fifth percentiles of flux. The usage of flux percentiles allows us to consider the global variability of the light curve.
Current usage metrics show cumulative count of Article Views (full-text article views including HTML views, PDF and ePub downloads, according to the available data) and Abstracts Views on Vision4Press platform.
Data correspond to usage on the plateform after 2015. The current usage metrics is available 48-96 hours after online publication and is updated daily on week days.
Initial download of the metrics may take a while.