Open Access
Fig. 5
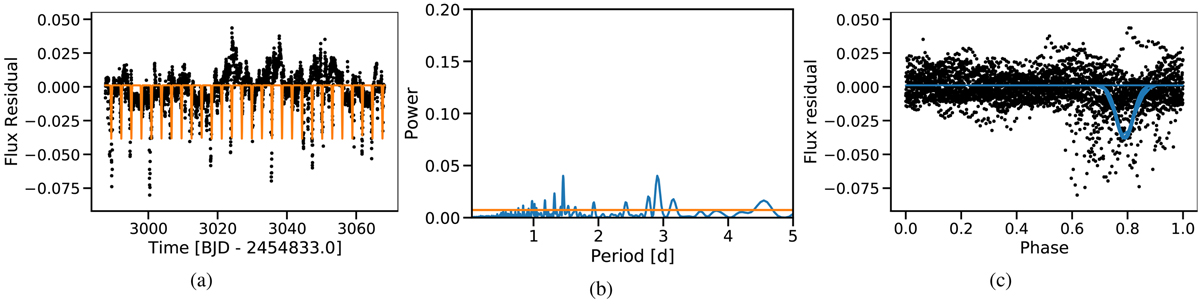
Fitting with periodic Gaussian pulses (a) of the residual light curve of EPIC 247885481 after the removal of the sinusoidal variability. (b) Periodogram of the residual light curve. The peak is far less evident, but still significant. (c) Residual light curve folded at 2.90 d with the fit Gaussian pulses (blue).
Current usage metrics show cumulative count of Article Views (full-text article views including HTML views, PDF and ePub downloads, according to the available data) and Abstracts Views on Vision4Press platform.
Data correspond to usage on the plateform after 2015. The current usage metrics is available 48-96 hours after online publication and is updated daily on week days.
Initial download of the metrics may take a while.