Fig. 4
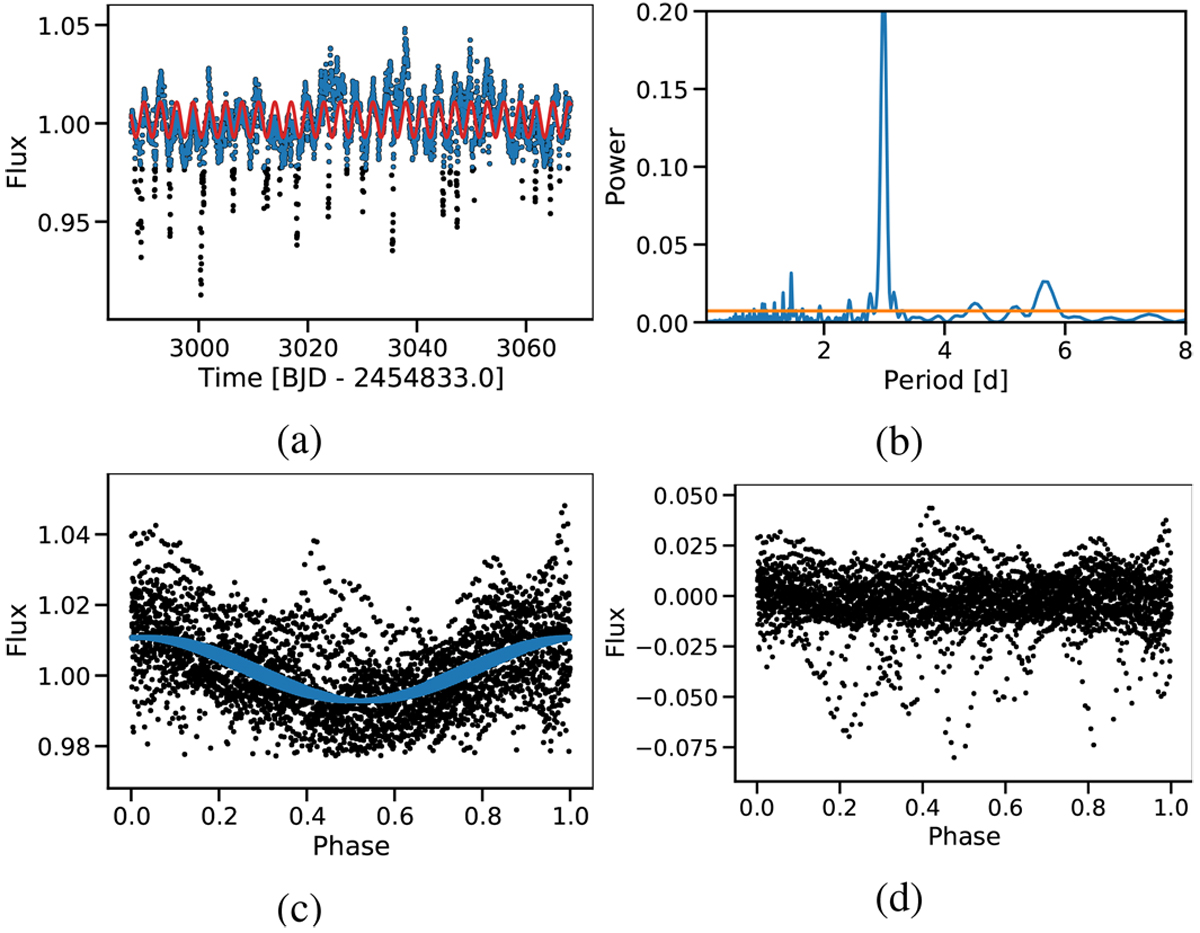
(a) Light curve of EPIC 247885481. Red: Sinusoidal fit of the flux above the fifth percentile (blue). (b) Periodogram of the star with the FAP level at 0.05 (orange). (c) Light curve above the fifth percentile folded at 2.99 d and sinusoidal fit (blue). (d) Residual light curve after subtraction of the fit as in panels a and c, folded at 2.99 d. The noise is high with respect to the dips, but no evident pattern is present.
Current usage metrics show cumulative count of Article Views (full-text article views including HTML views, PDF and ePub downloads, according to the available data) and Abstracts Views on Vision4Press platform.
Data correspond to usage on the plateform after 2015. The current usage metrics is available 48-96 hours after online publication and is updated daily on week days.
Initial download of the metrics may take a while.