Fig. 3
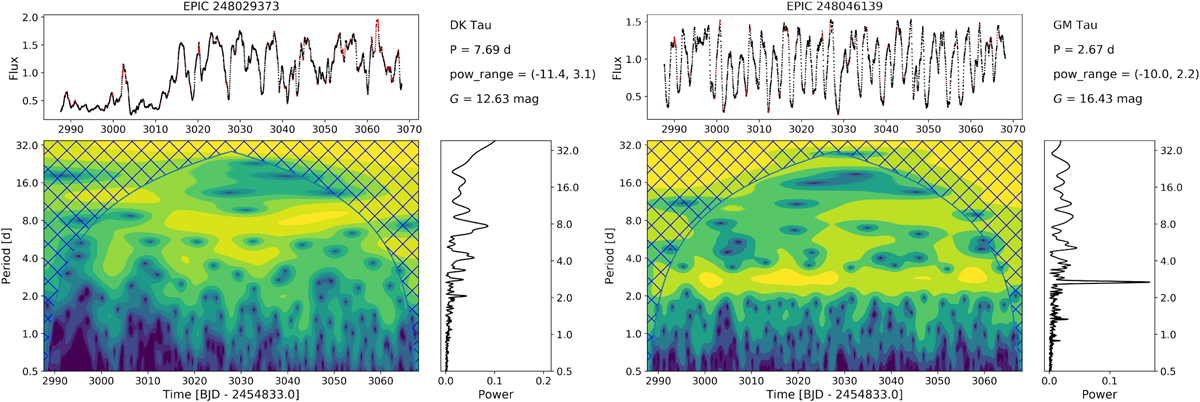
Different examples of WPS for a time-resolved changing period (DK Tau) and a periodic dipper (GM Tau). Top panel: light curves with interpolated points marked in red. Left panel: 2D WPS. The crossed lines mark the COI, where edge effects of the wavelet transform become relevant. The power contours extend from low (blue) to high (yellow). The power range and the Gaia magnitude are annotated in the upper right corner. Right panel: CLEAN periodogram. The logarithmic y-axis with the periods is the same as for the WPS. In the case of DK Tau (left), the two peaks in the periodogram at ~8 and ~10 d can be interpreted as a single period that changes during the observations by means of the WPS. GM Tau displays only one clear period in the WPS and the periodogram. The green stripe at ~10 d is just a recurring pattern in the light curve: a deeper dip at t = 3030, 3040, 3050 d. This is not a relevant periodicity and does not appear in the periodogram.
Current usage metrics show cumulative count of Article Views (full-text article views including HTML views, PDF and ePub downloads, according to the available data) and Abstracts Views on Vision4Press platform.
Data correspond to usage on the plateform after 2015. The current usage metrics is available 48-96 hours after online publication and is updated daily on week days.
Initial download of the metrics may take a while.