Fig. 11
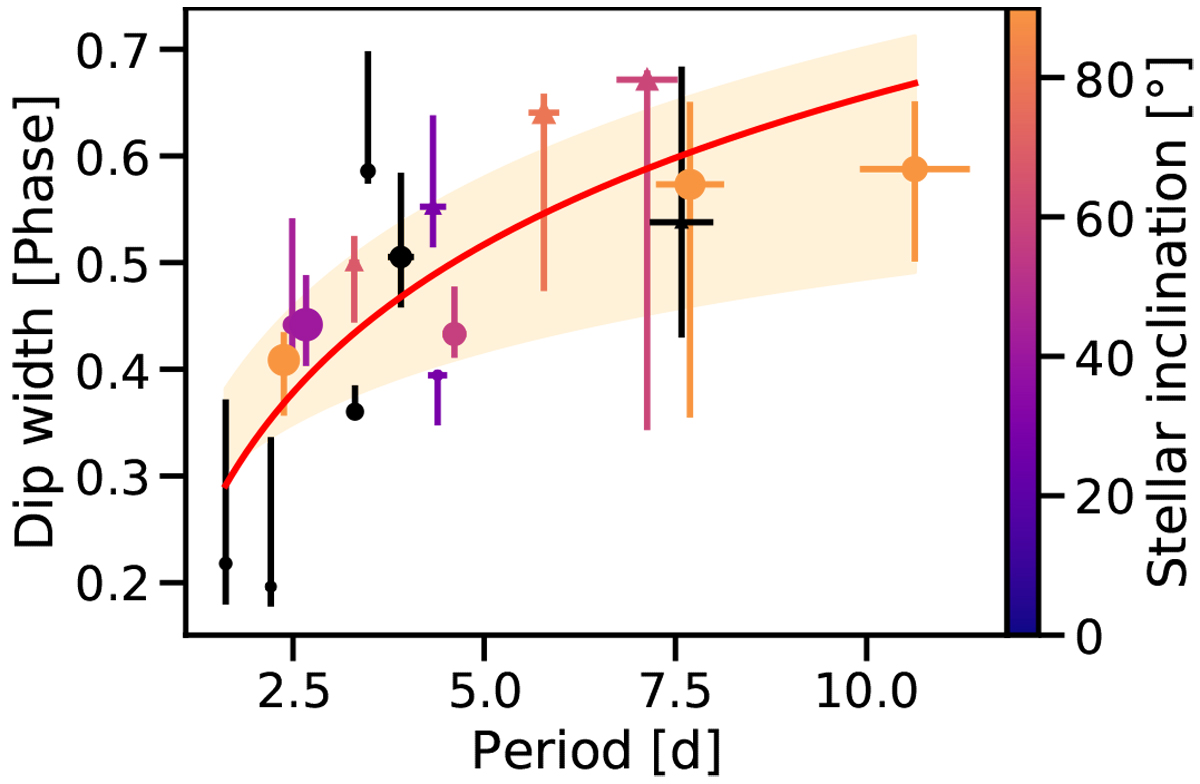
Dependence of dip width in phase units and period of the quasiperiodic stars in the dipper sample. The error bars on dip width and period correspond to those listed in Table 4. A logarithmic fit a log x + b is performed just on the data points (red line), and for upper and lower limits of the dip width (orange interval). The double-dipped stars are represented as triangles. The size of the markers is proportional to the square root of the dip amplitude (between 0.05 and 1.3 mag). Two stars for which the dip width derived in this way is not reliable arenot represented in this plot. The stellar inclination in degrees is coded as colors of the data points, when available. Although the exact coefficients of the fitting function cannot be constrained from this small sample, W correlates with lnP with Pearson’s r = 0.77. No significant correlation with the dip amplitude can be measured.
Current usage metrics show cumulative count of Article Views (full-text article views including HTML views, PDF and ePub downloads, according to the available data) and Abstracts Views on Vision4Press platform.
Data correspond to usage on the plateform after 2015. The current usage metrics is available 48-96 hours after online publication and is updated daily on week days.
Initial download of the metrics may take a while.