Fig. 9
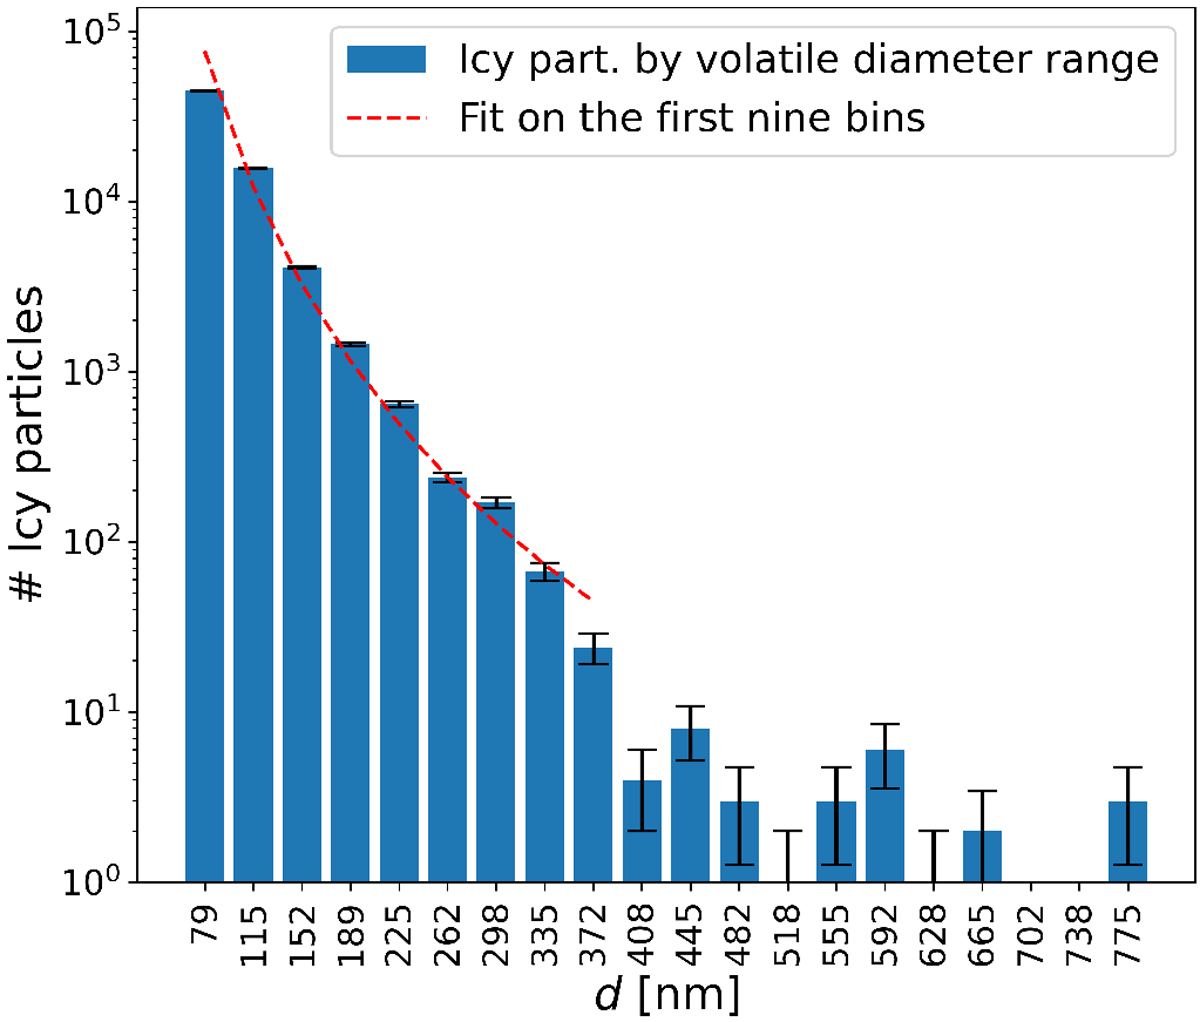
Size distribution of the volatile content of the icy particles. The horizontal axis shows the diameters of spherical particles (density of 1 g cm−3) having the same volume as the volatiles in the icy particles. The displayed x-axis values are the central values of bins with a width of ~36.5 nm (the width was chosen so as to have exactly 20 bins). The values were calculated with Eq. (1) and the error bars represent the statistical error. The red dashed line is the best fit of the first nine bins according to Eq. (3).
Current usage metrics show cumulative count of Article Views (full-text article views including HTML views, PDF and ePub downloads, according to the available data) and Abstracts Views on Vision4Press platform.
Data correspond to usage on the plateform after 2015. The current usage metrics is available 48-96 hours after online publication and is updated daily on week days.
Initial download of the metrics may take a while.