Fig. 8
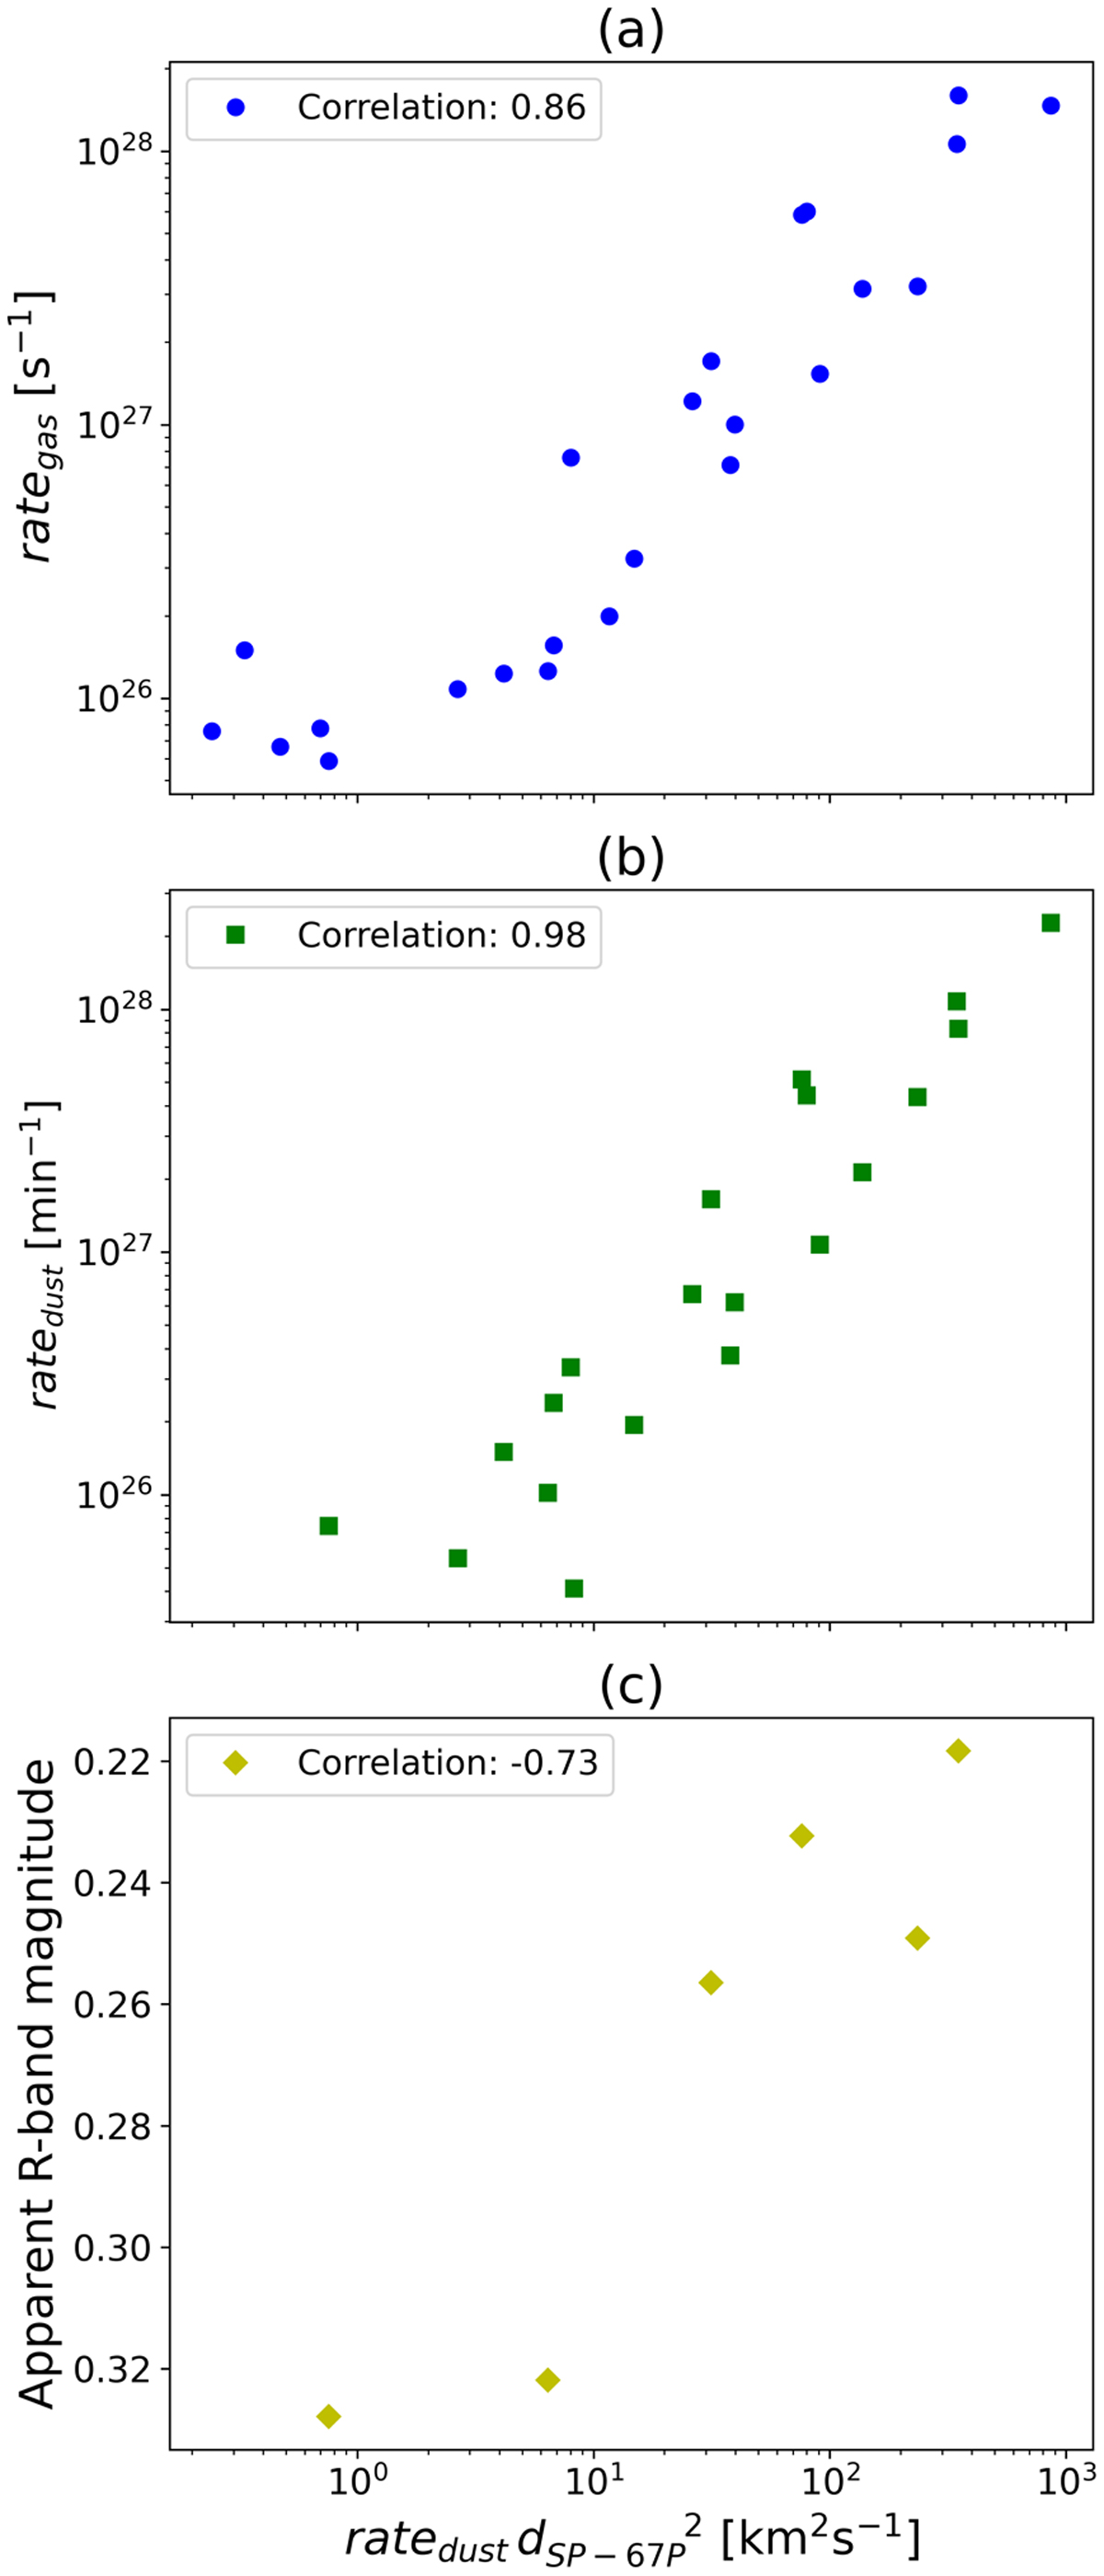
Direct comparisons of the datasets from Fig. 6. Panel a: monthly averages of the gas production rate Q (derived from NG data) plotted against the monthly NG detection rate multiplied by the square of the average cometocentric distance. The Pearson correlation coefficient is 0.86. Panel b: monthly averages of the water production rate (Hansen et al. 2016) versus the monthly NG detection rate multiplied by the square of the average cometocentric distance. The Pearson correlation coefficient between the two quantities is 0.98. Panel c: monthly average of the ground-based measurements of the brightness of 67P (Snodgrass et al. 2016) versus the monthly NG detection rate multiplied by the square of the average cometocentric distance. The Pearson correlation coefficient is −0.73.
Current usage metrics show cumulative count of Article Views (full-text article views including HTML views, PDF and ePub downloads, according to the available data) and Abstracts Views on Vision4Press platform.
Data correspond to usage on the plateform after 2015. The current usage metrics is available 48-96 hours after online publication and is updated daily on week days.
Initial download of the metrics may take a while.