Fig. 6
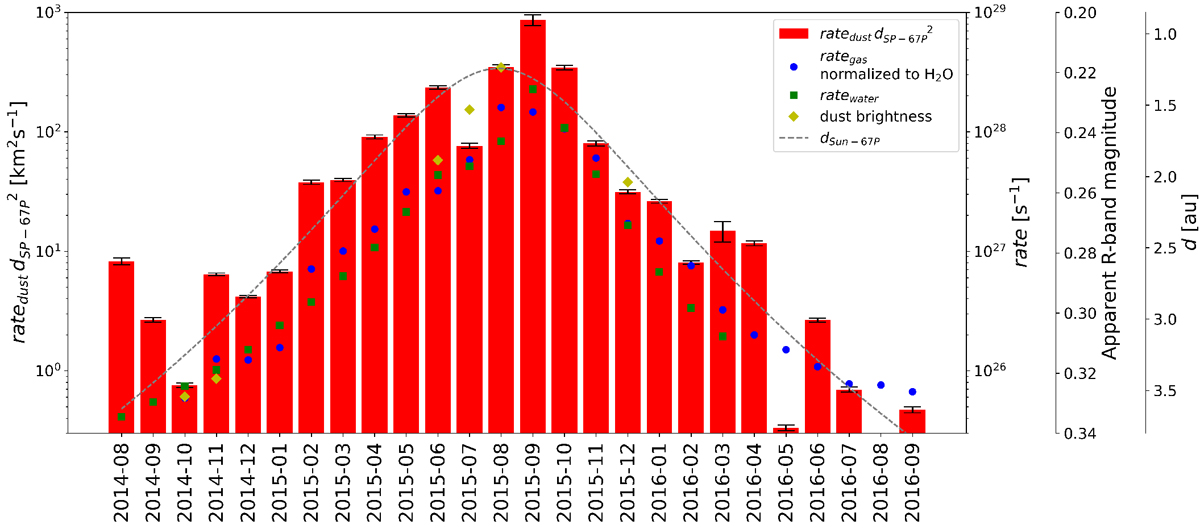
Comparison of histogram of the NG detection rate multiplied by the square of the average cometocentric distance (red bars), with the monthly averages of the gas production rate Q (normalised to H2O) calculated from the NG data (blue dots), the water production rate from Hansen et al. (2016, Fig. 9) (green squares), the ground-based dust brightness observations of Snodgrass et al. (2016) (yellow diamonds), and the heliocentric distance (grey dashed line).
Current usage metrics show cumulative count of Article Views (full-text article views including HTML views, PDF and ePub downloads, according to the available data) and Abstracts Views on Vision4Press platform.
Data correspond to usage on the plateform after 2015. The current usage metrics is available 48-96 hours after online publication and is updated daily on week days.
Initial download of the metrics may take a while.