Fig. 4
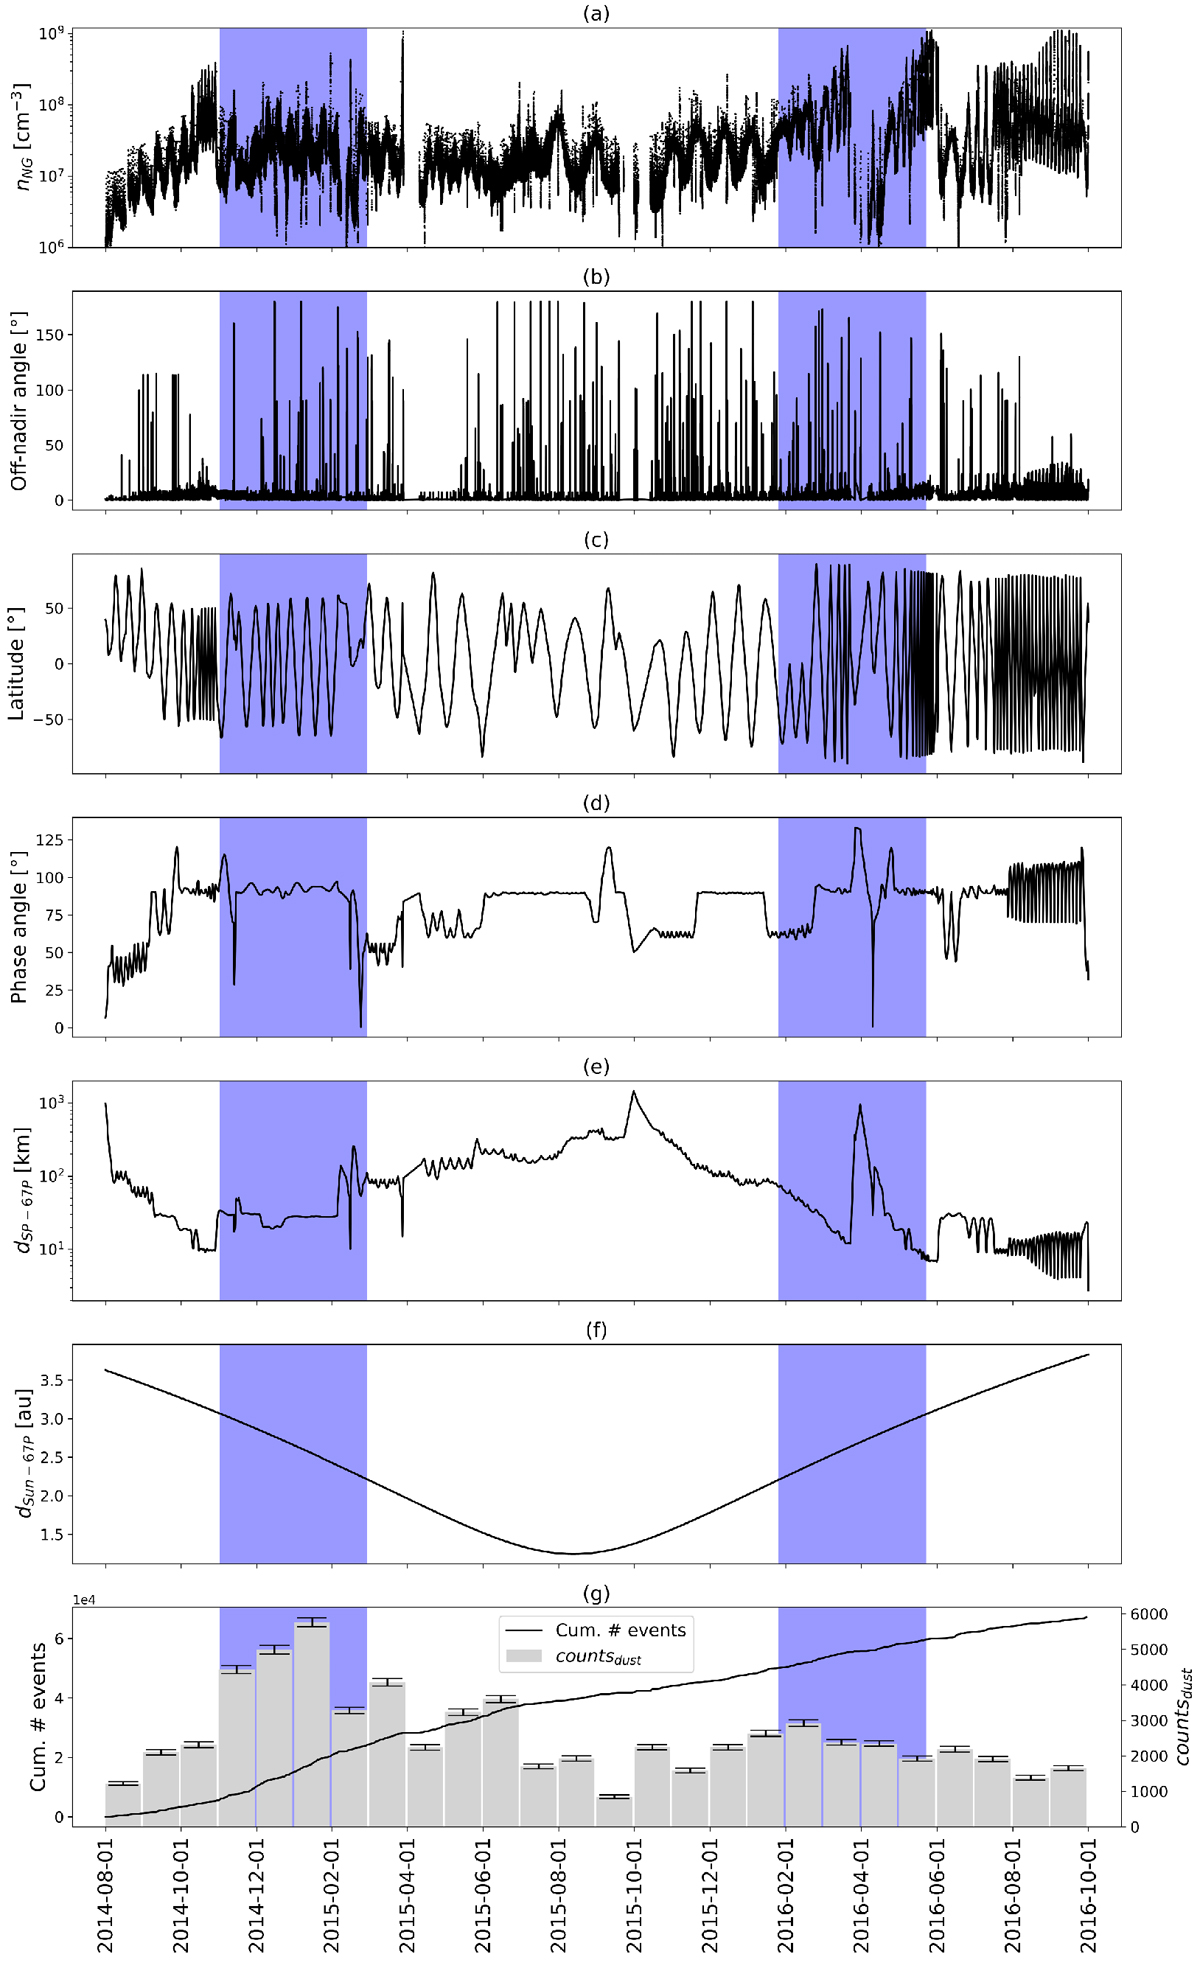
Six parameters investigated in this study, together with the number of detections, plotted as a function of time. From top to bottom: (a) density (nominal NG signal); (b) off-nadir angle; (c) (sub-spacecraft) latitude; (d) phase angle; (e) cometocentric distance; (f) heliocentric distance; (g) cumulative number of NG detection events and number of icy particles detected by the NG per month (the error bars represent the statistical uncertainty). The blue bands indicate the periods that are investigated for dependencies on the results of the cometocentric and heliocentric distances.
Current usage metrics show cumulative count of Article Views (full-text article views including HTML views, PDF and ePub downloads, according to the available data) and Abstracts Views on Vision4Press platform.
Data correspond to usage on the plateform after 2015. The current usage metrics is available 48-96 hours after online publication and is updated daily on week days.
Initial download of the metrics may take a while.