Fig. 3
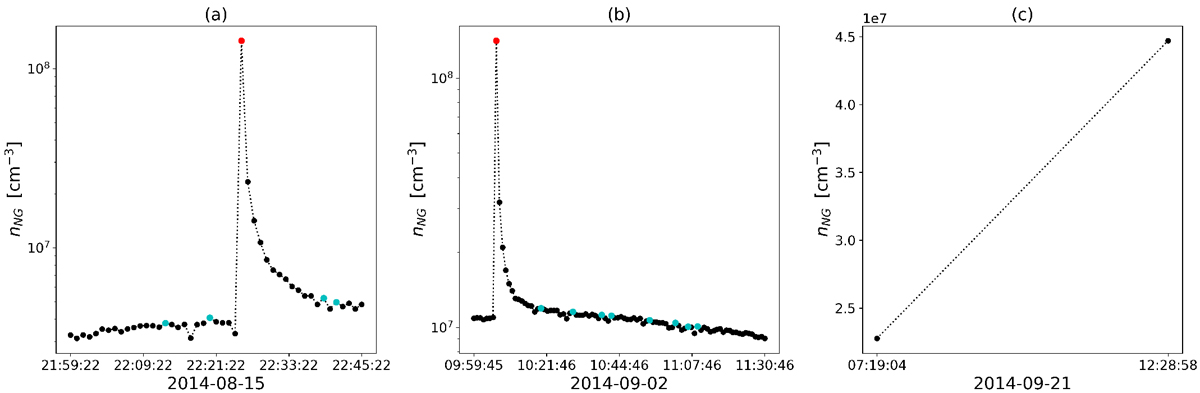
Examples of NG density measurements during the three thruster operation periods. Dots represent actual measurements, whereas the dotted line connecting individual measurements acts as a reference to better visualise the changes in the density. The cyan dots indicate features generated by the sublimation of the volatile content of icy particles, whereas the red dots denote the features generated by thruster firings. Panel a: wheel offloading and navigation manoeuvre (MWNV) executed between 21:59:22 and 22:45:22 on 2014-08-15. The plot contains four features generated by the volatile content of icy particles and one (big) feature caused by the thrusters. Panel b: wheel offloading manoeuvre (MWOL) executed between 09:59:45 and 11:30:46 on 2014-09-02. The graph contains a thruster feature and eight features generated by the volatile content of icy coma particles. Panel c: orbital correction manoeuvre (MOCM) performed from 07:19:04 to 12:28:58 on 2014-09-21. In this time interval, no measurements were taken by the NG for about five hours.
Current usage metrics show cumulative count of Article Views (full-text article views including HTML views, PDF and ePub downloads, according to the available data) and Abstracts Views on Vision4Press platform.
Data correspond to usage on the plateform after 2015. The current usage metrics is available 48-96 hours after online publication and is updated daily on week days.
Initial download of the metrics may take a while.