Fig. 1
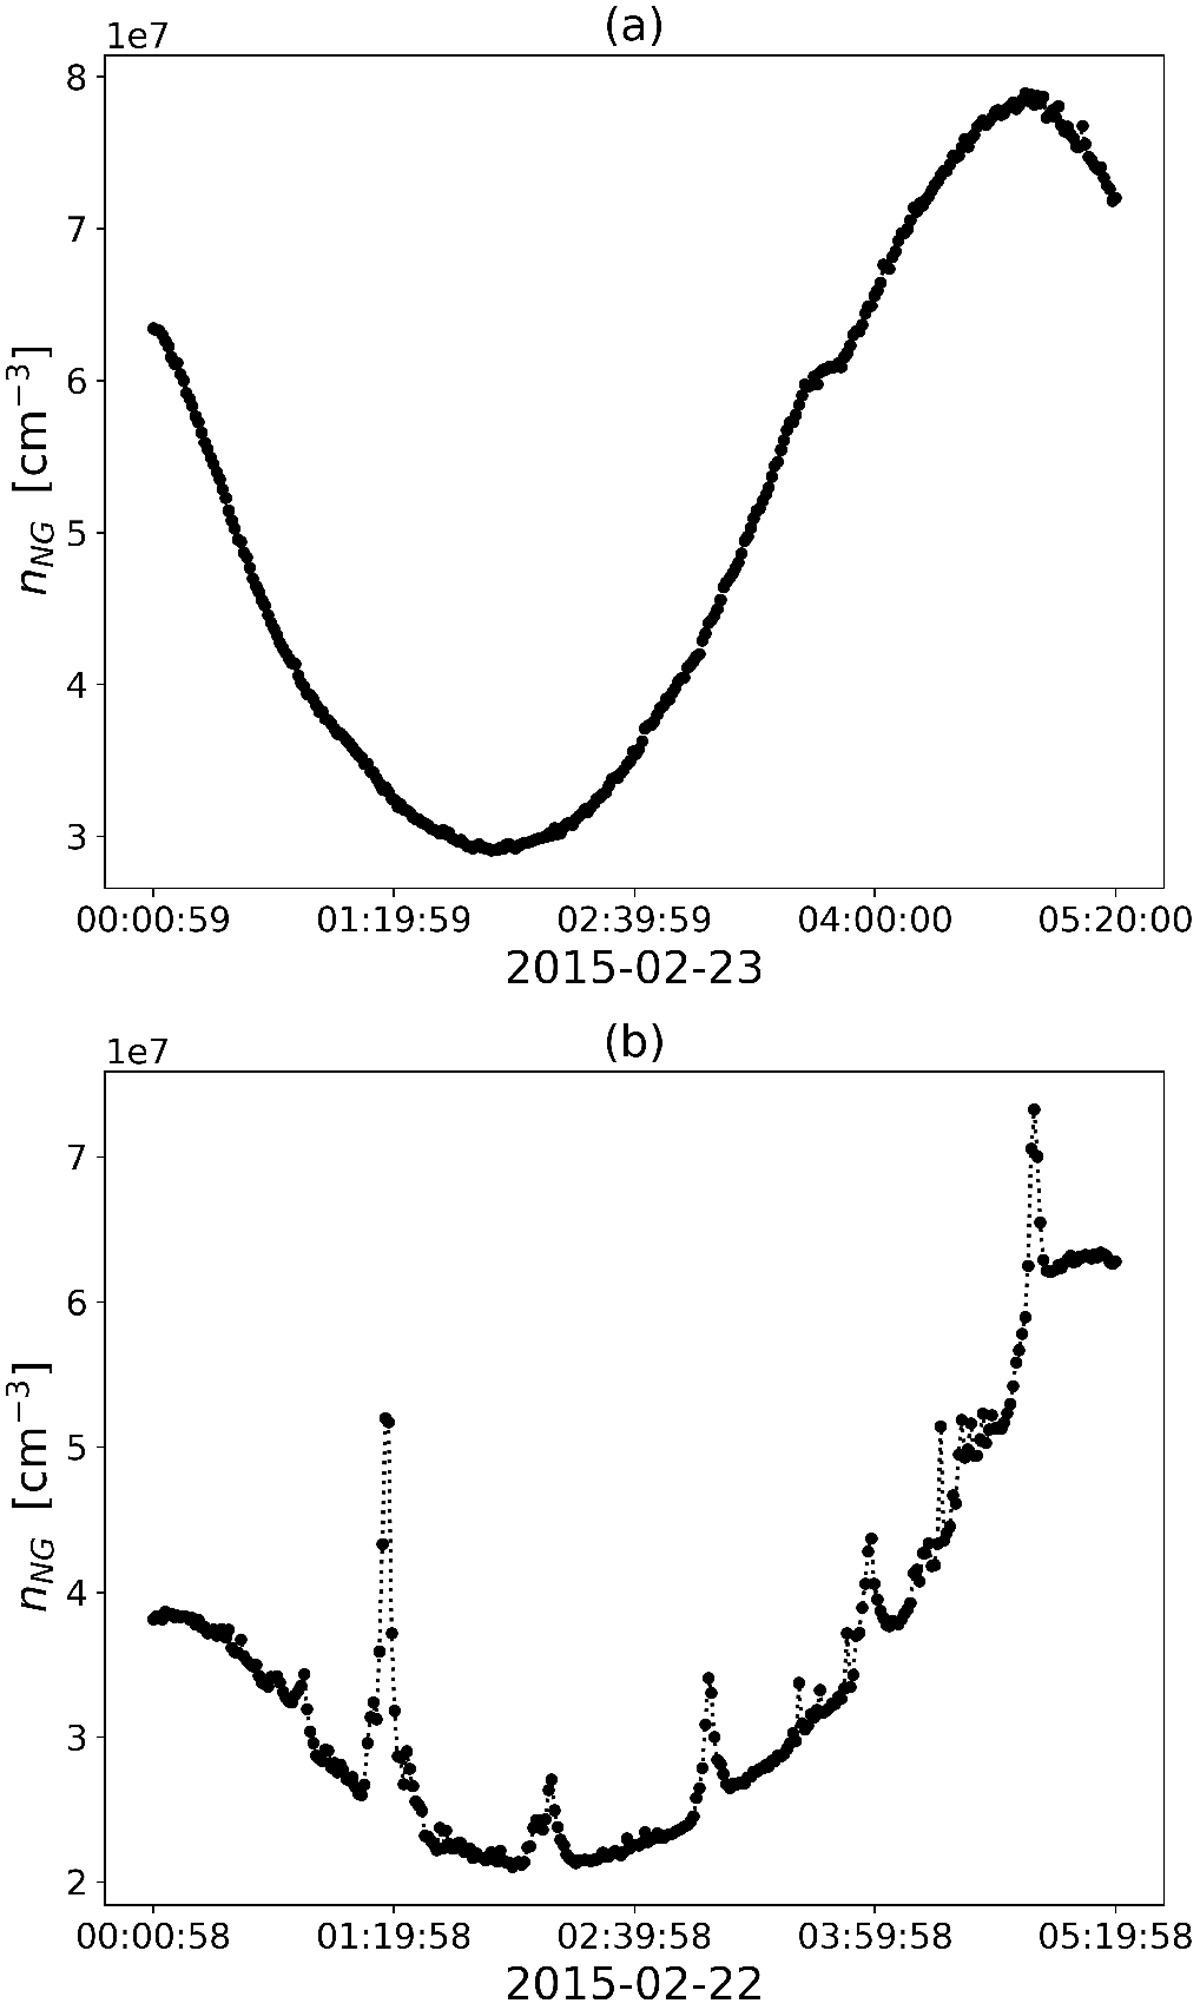
Density measured by the NG. Dots represent actual measurements, whereas the dotted line connects the measurements to better visualise the trend. Panel a: measurements on 2015-02-23 between 00:00:59 and 05:20:00 without sublimating icy particle signatures. Panel b: measurements on 2015-02-22 between 00:00:58 and 05:19:58 with sublimating icy particle signatures.
Current usage metrics show cumulative count of Article Views (full-text article views including HTML views, PDF and ePub downloads, according to the available data) and Abstracts Views on Vision4Press platform.
Data correspond to usage on the plateform after 2015. The current usage metrics is available 48-96 hours after online publication and is updated daily on week days.
Initial download of the metrics may take a while.