Fig. 4.
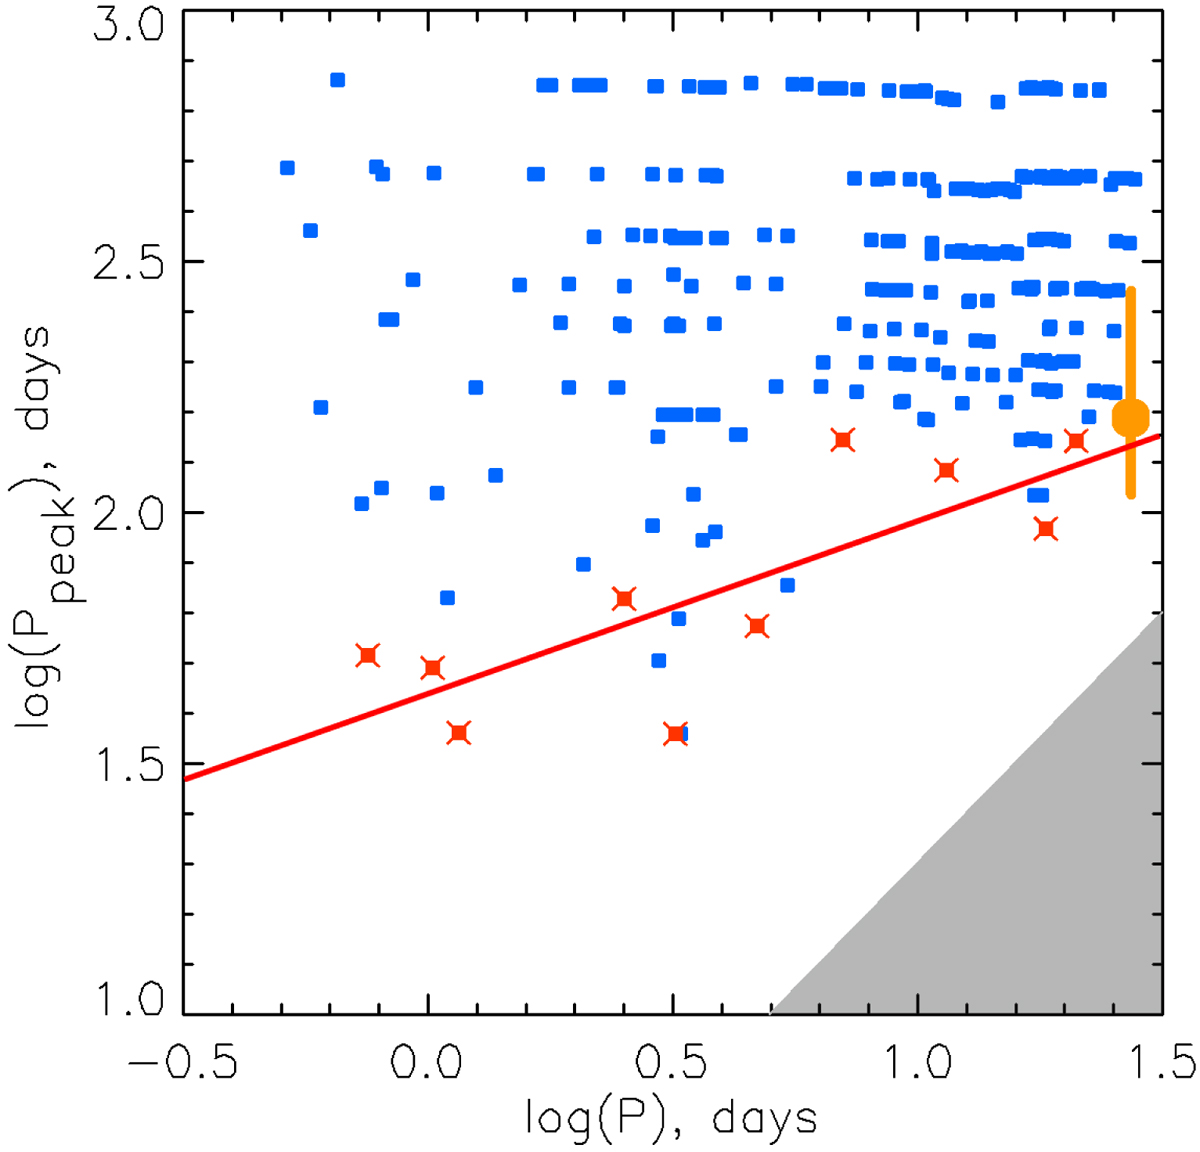
Distribution of the log(Ppeak) estimates vs. log of the stellar rotation periods P for the solar-type stars with 5500 < Teff < 6000 K. For comparison, the position of solar RTCs is indicated with a yellow circle which corresponds to Ppeak = 154 days according to Rieger et al. (1984). The bar denotes the total range of solar RTCs according to Feng et al. (2017). The red line shows the linear regression of the lower border set of the log(Ppeak) cluster, obtained for the minimum values of Ppeak (red crossed squares) defined for the sequential ten intervals of P. The gray area in the lower right corner of the plot indicates the detection limit zone for Ppeak, restricted by the Nyquist frequency (2P)−1.
Current usage metrics show cumulative count of Article Views (full-text article views including HTML views, PDF and ePub downloads, according to the available data) and Abstracts Views on Vision4Press platform.
Data correspond to usage on the plateform after 2015. The current usage metrics is available 48-96 hours after online publication and is updated daily on week days.
Initial download of the metrics may take a while.